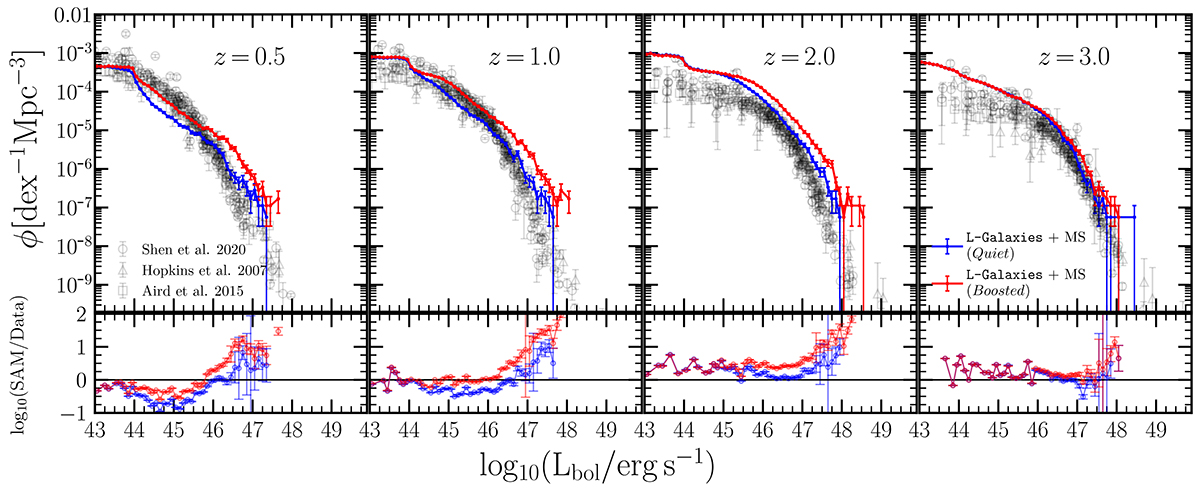
Fig. 1.
Download original image
Quasar luminosity functions at z = 0.5, 1.0, 2.0, 3.0 for the Quiet (blue) and Boosted model (red) run in the Millennium merger trees (i.e. L-Galaxies + MS). The error bars correspond to the Poissonian error. The results are compared with the observations of Hopkins et al. (2007) (triangles), Aird et al. (2015) (squares) and Shen et al. (2020) (circles). The lower panel represents the ratio between the model and the data points.
Current usage metrics show cumulative count of Article Views (full-text article views including HTML views, PDF and ePub downloads, according to the available data) and Abstracts Views on Vision4Press platform.
Data correspond to usage on the plateform after 2015. The current usage metrics is available 48-96 hours after online publication and is updated daily on week days.
Initial download of the metrics may take a while.