Open Access
Fig. A.1
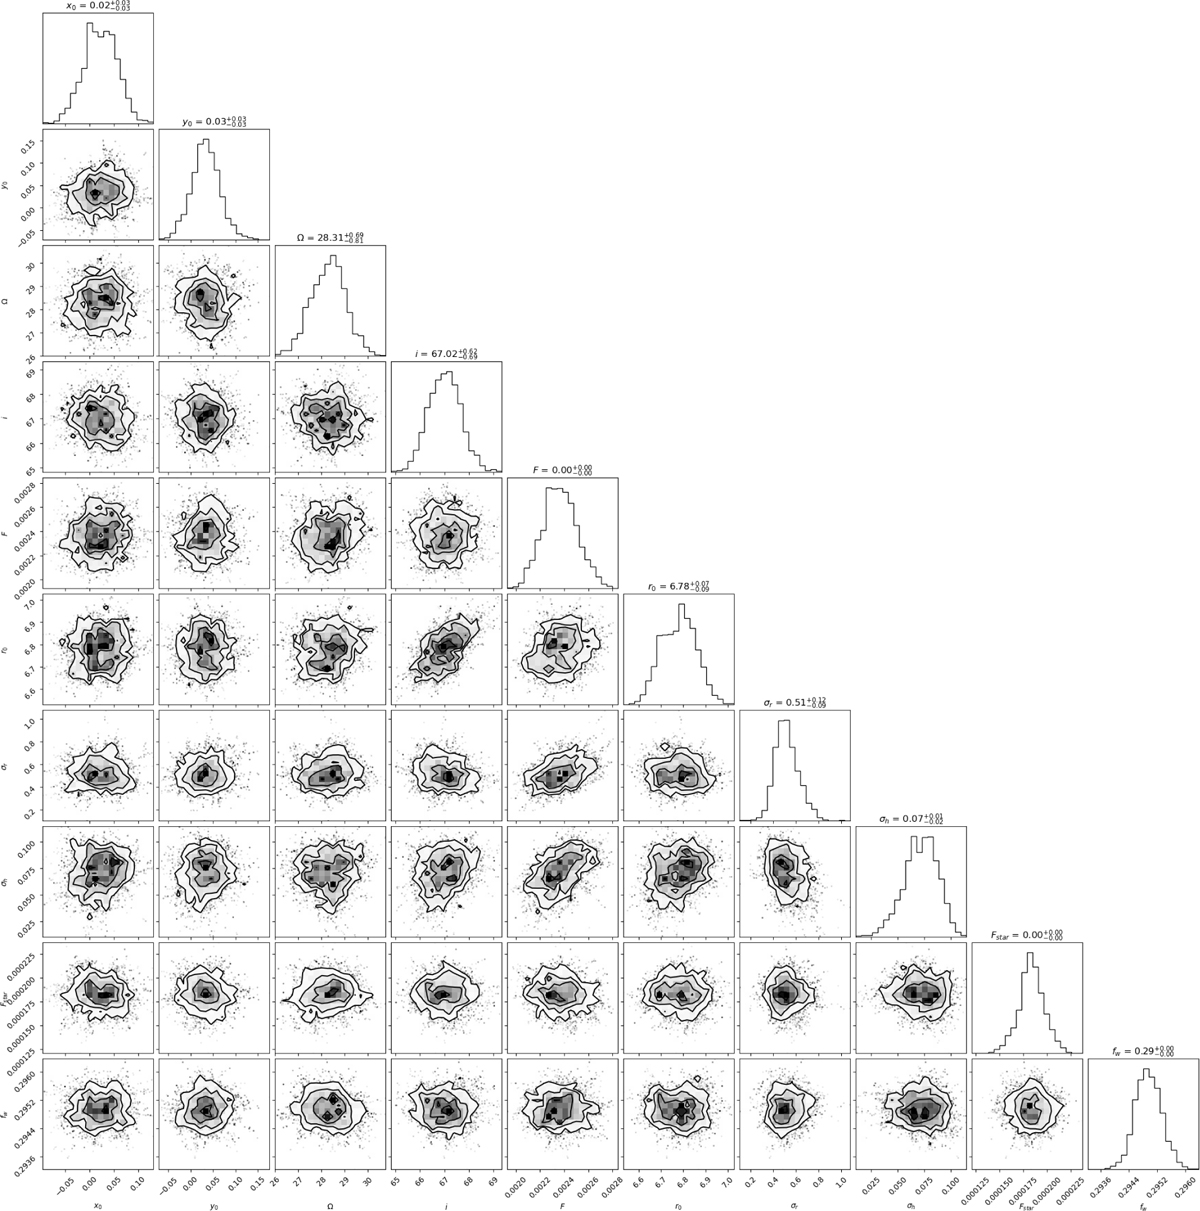
Download original image
Corner plot showing the posterior probability distributions for the emcee runs used to identify the maximum amplitude probability model and calculate the uncertainties. The posteriors are mono-modal and well behaved except for the inclination, which runs up against the edge of the allowed parameter space (90°).
Current usage metrics show cumulative count of Article Views (full-text article views including HTML views, PDF and ePub downloads, according to the available data) and Abstracts Views on Vision4Press platform.
Data correspond to usage on the plateform after 2015. The current usage metrics is available 48-96 hours after online publication and is updated daily on week days.
Initial download of the metrics may take a while.