Fig. 6
Download original image
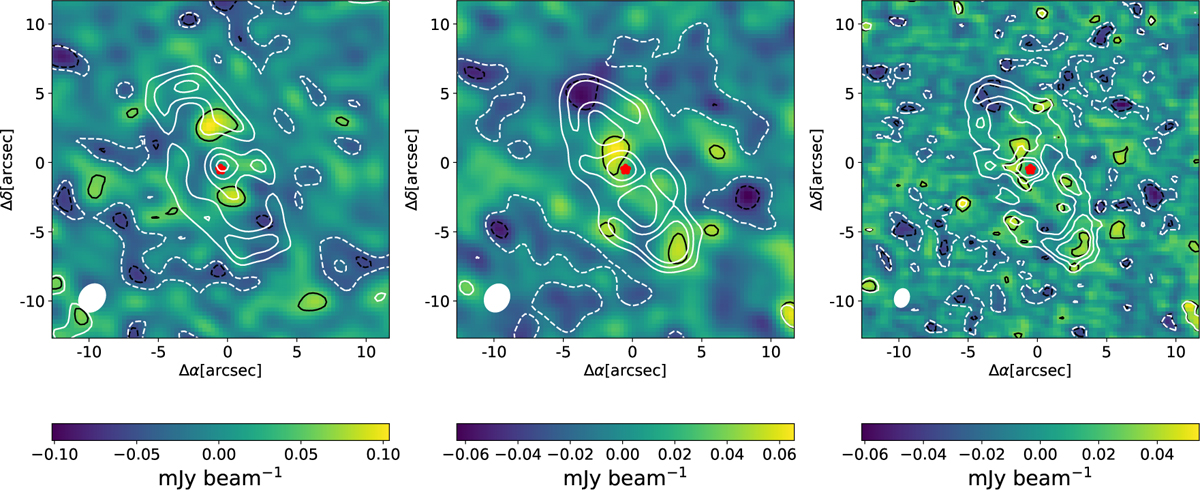
Residual maps using the same contour levels ([−2, 2, 4, 6] × σrms, left: σrms = 27 μJy beam−1, middle: σrms = 22 μJy beam−1, right: σrms = 15 μJy beam−1) and beam sizes (left: 2.24″ × 1.84″, middle: 2.28″ × 1.89″, right: 1.43″ × 1.12″) as Fig. 3. We added contours of the continuum image (white) to compare the residual positions.
Current usage metrics show cumulative count of Article Views (full-text article views including HTML views, PDF and ePub downloads, according to the available data) and Abstracts Views on Vision4Press platform.
Data correspond to usage on the plateform after 2015. The current usage metrics is available 48-96 hours after online publication and is updated daily on week days.
Initial download of the metrics may take a while.