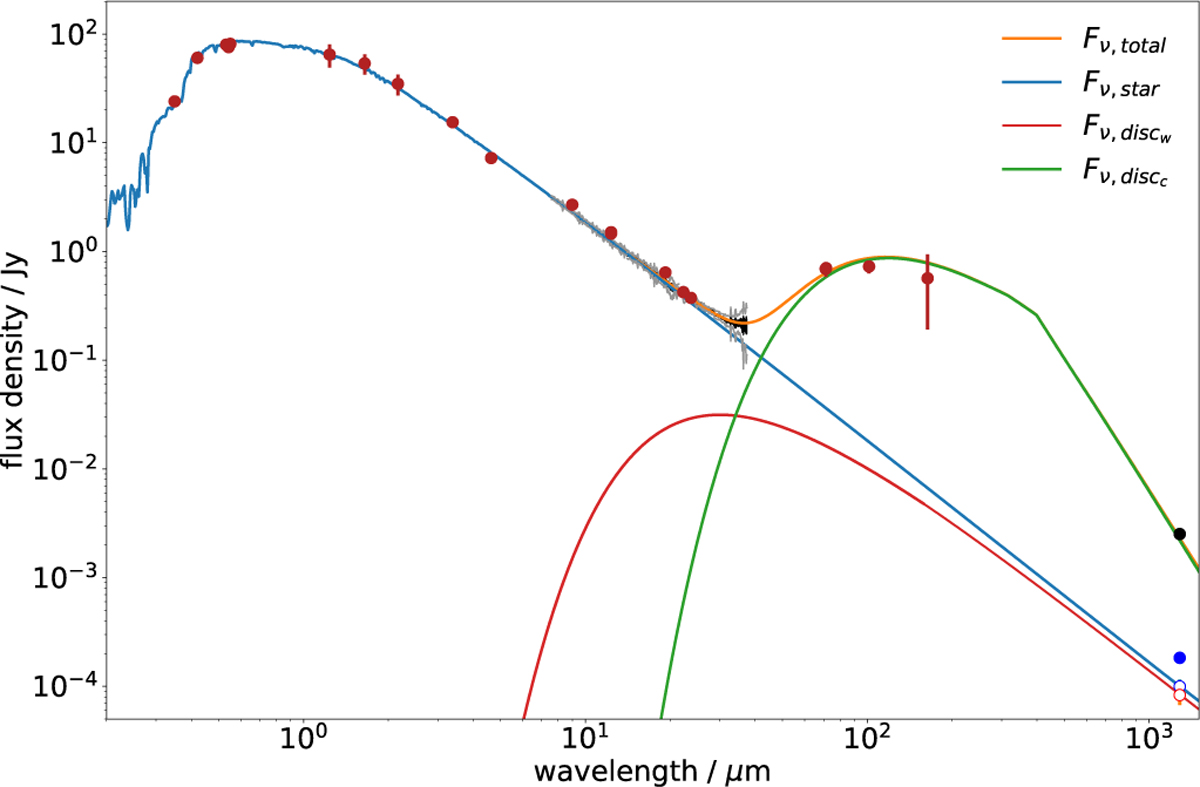
Fig. 4
Download original image
Spectral energy distribution of HD 105211. The photometry from the literature is plotted as red circles. The new ALMA observation is marked as a black circle, and the blue circle represents the flux at the stellar position. The blue open circle donates the expected stellar flux, and the red open circle donates the flux seen at the stellar position after subtracting the predicted stellar flux. The shaded black line corresponds to the Spitzer IRS spectrum, and the grey line represents its ±3σ uncertainties. The blue line represents the stellar photosphere emission. The green and red lines denote disc emission of the cold and warm components, respectively, whilst the orange line denotes their total emission.
Current usage metrics show cumulative count of Article Views (full-text article views including HTML views, PDF and ePub downloads, according to the available data) and Abstracts Views on Vision4Press platform.
Data correspond to usage on the plateform after 2015. The current usage metrics is available 48-96 hours after online publication and is updated daily on week days.
Initial download of the metrics may take a while.