Fig. 3
Download original image
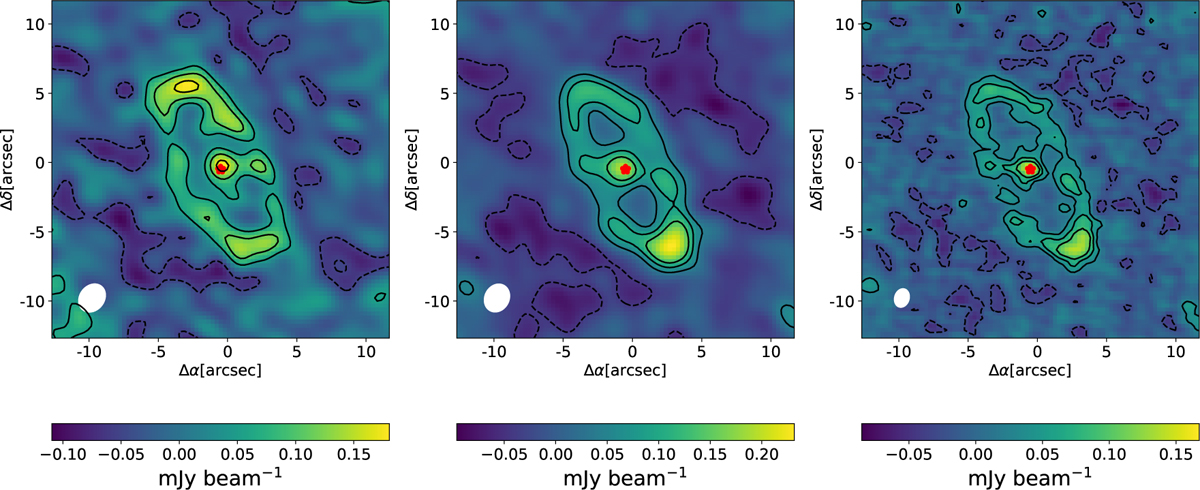
Continuum images of the two observation blocks with natural weighting. The left panel is for OB1 on 2017 March 28, and the right panel is for OB2 on 2018 May 9. The middle panel represents the UV tapering (1.8″ × 1.5″) image of OB2 for matching the beam size of OB1. Contours are drawn at the levels of [−2, 2, 4, 6] × σrms(left: σrms = 27 μJy beam−1, middle: σrms = 22 μJy beam−1, right: σrms = 15 μJy beam−1) to better highlight the disc structure. The beam size is represented by a white ellipse (left: 2.24″ × 1.84″, middle: 2.28″ × 1.89″, right: 1.43″ × 1.12″) in the bottom-left corner. The star location is marked with a red star symbol.
Current usage metrics show cumulative count of Article Views (full-text article views including HTML views, PDF and ePub downloads, according to the available data) and Abstracts Views on Vision4Press platform.
Data correspond to usage on the plateform after 2015. The current usage metrics is available 48-96 hours after online publication and is updated daily on week days.
Initial download of the metrics may take a while.