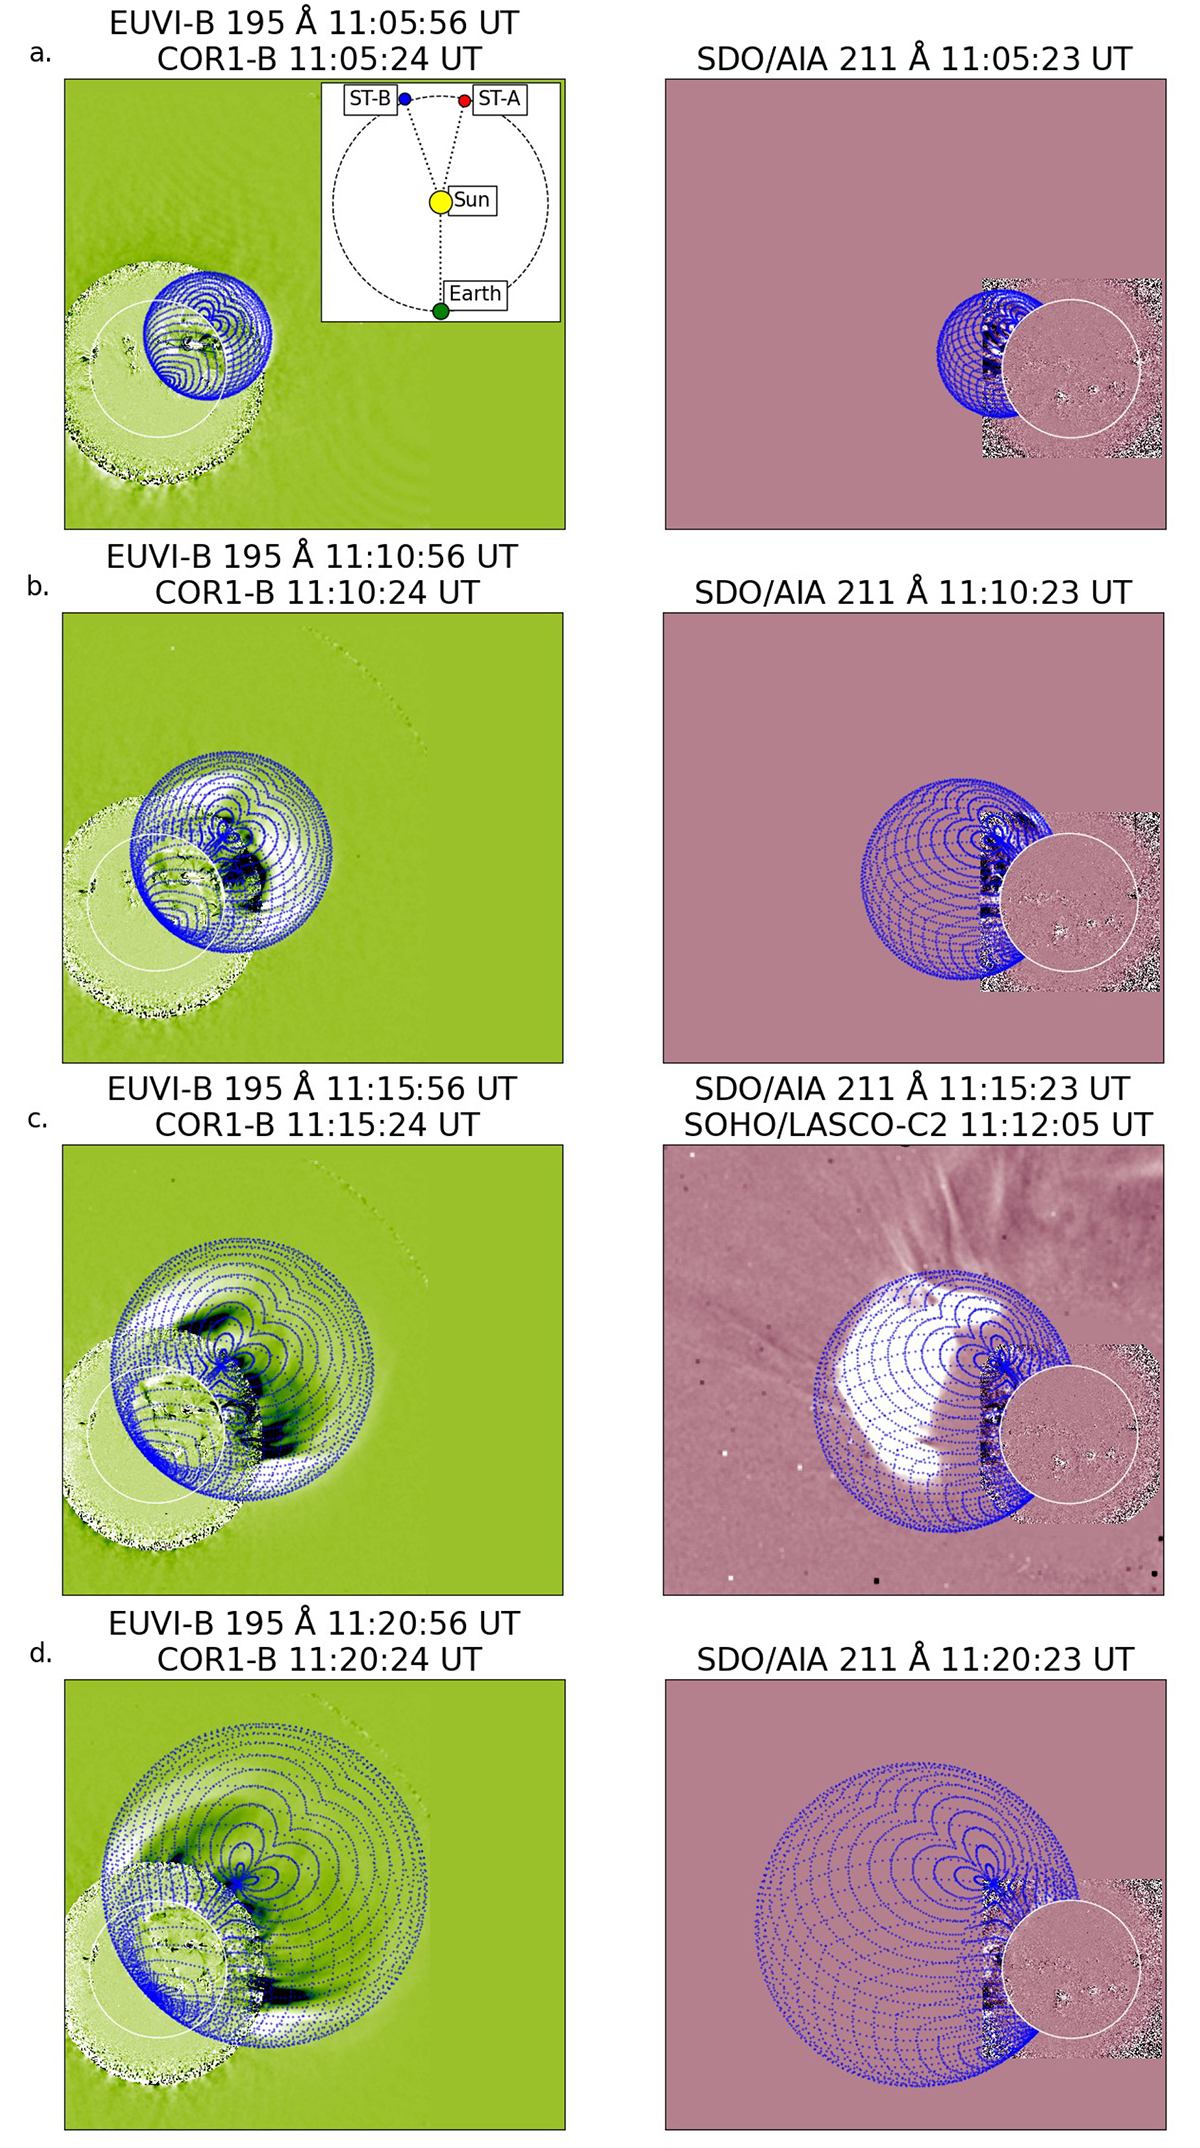
Fig. 4.

Download original image
Fitting of the CME shock with the GCS model at four different times: (a) 11:05, (b) 11:10, (c) 11:15, and (d) 11:20 UT. The panels show the fit as seen from STEREO-B (left) and Earth (right). In addition, panel a shows the location of the observing spacecraft relative to the Sun. The GCS model (blue) is overlaid on the EUV and white-light running difference images. The EUV observations consist of STEREO/SECCHI/EUVI-B at 195 Å and SDO/AIA at 211 Å. The white-light observations were mainly made by STEREO/SECCHI/COR1-B, with the exception of the right panel in c where SOHO/LASCO C2 data was available. The time interval between the images used to produce the running difference images is 5 min for both EUVI-B and COR1-B and 12 min for LASCO C2.
Current usage metrics show cumulative count of Article Views (full-text article views including HTML views, PDF and ePub downloads, according to the available data) and Abstracts Views on Vision4Press platform.
Data correspond to usage on the plateform after 2015. The current usage metrics is available 48-96 hours after online publication and is updated daily on week days.
Initial download of the metrics may take a while.


