Fig. 3
Download original image
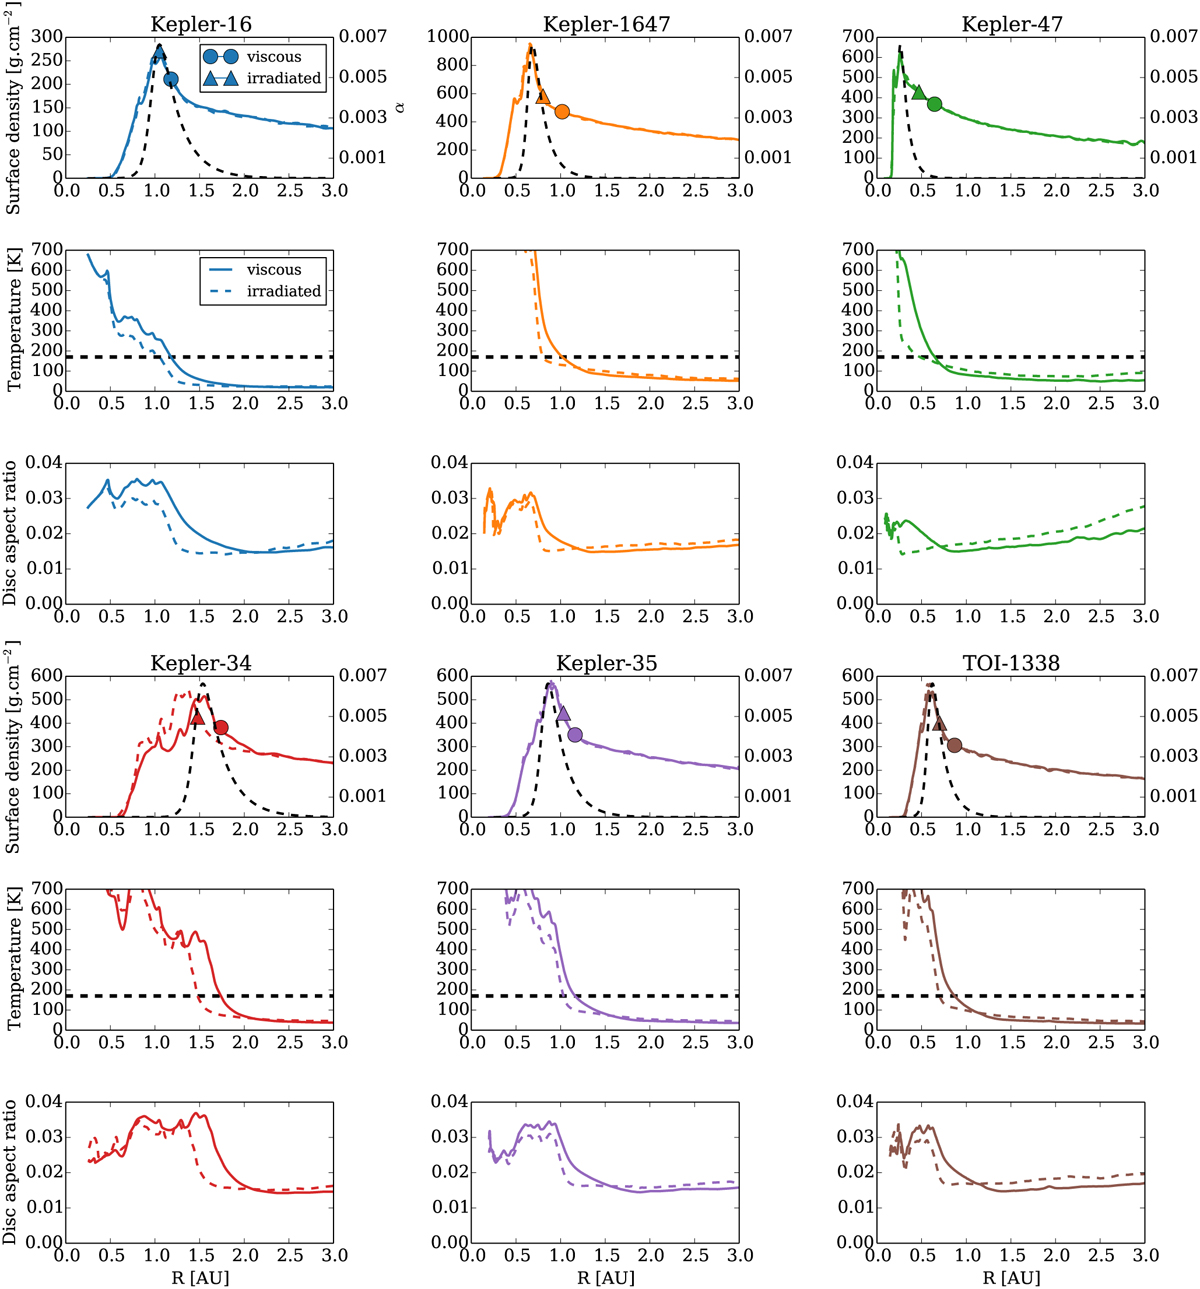
Surface density, midplane temperature, and aspect ratio profiles of the different circumbinary systems that we considered. Solid lines correspond to models that include viscous heating, whereas dashed lines are for models without viscous heating. All models include irradiation and shock heating. In the surface density profiles, the markers indicate the location of the ice line, which is also represented as a horizontal dashed line in the temperature plots. The dashed black lines in the surface density plots show the values of α in the viscously heated models – see the right-hand vertical axis.
Current usage metrics show cumulative count of Article Views (full-text article views including HTML views, PDF and ePub downloads, according to the available data) and Abstracts Views on Vision4Press platform.
Data correspond to usage on the plateform after 2015. The current usage metrics is available 48-96 hours after online publication and is updated daily on week days.
Initial download of the metrics may take a while.