Open Access
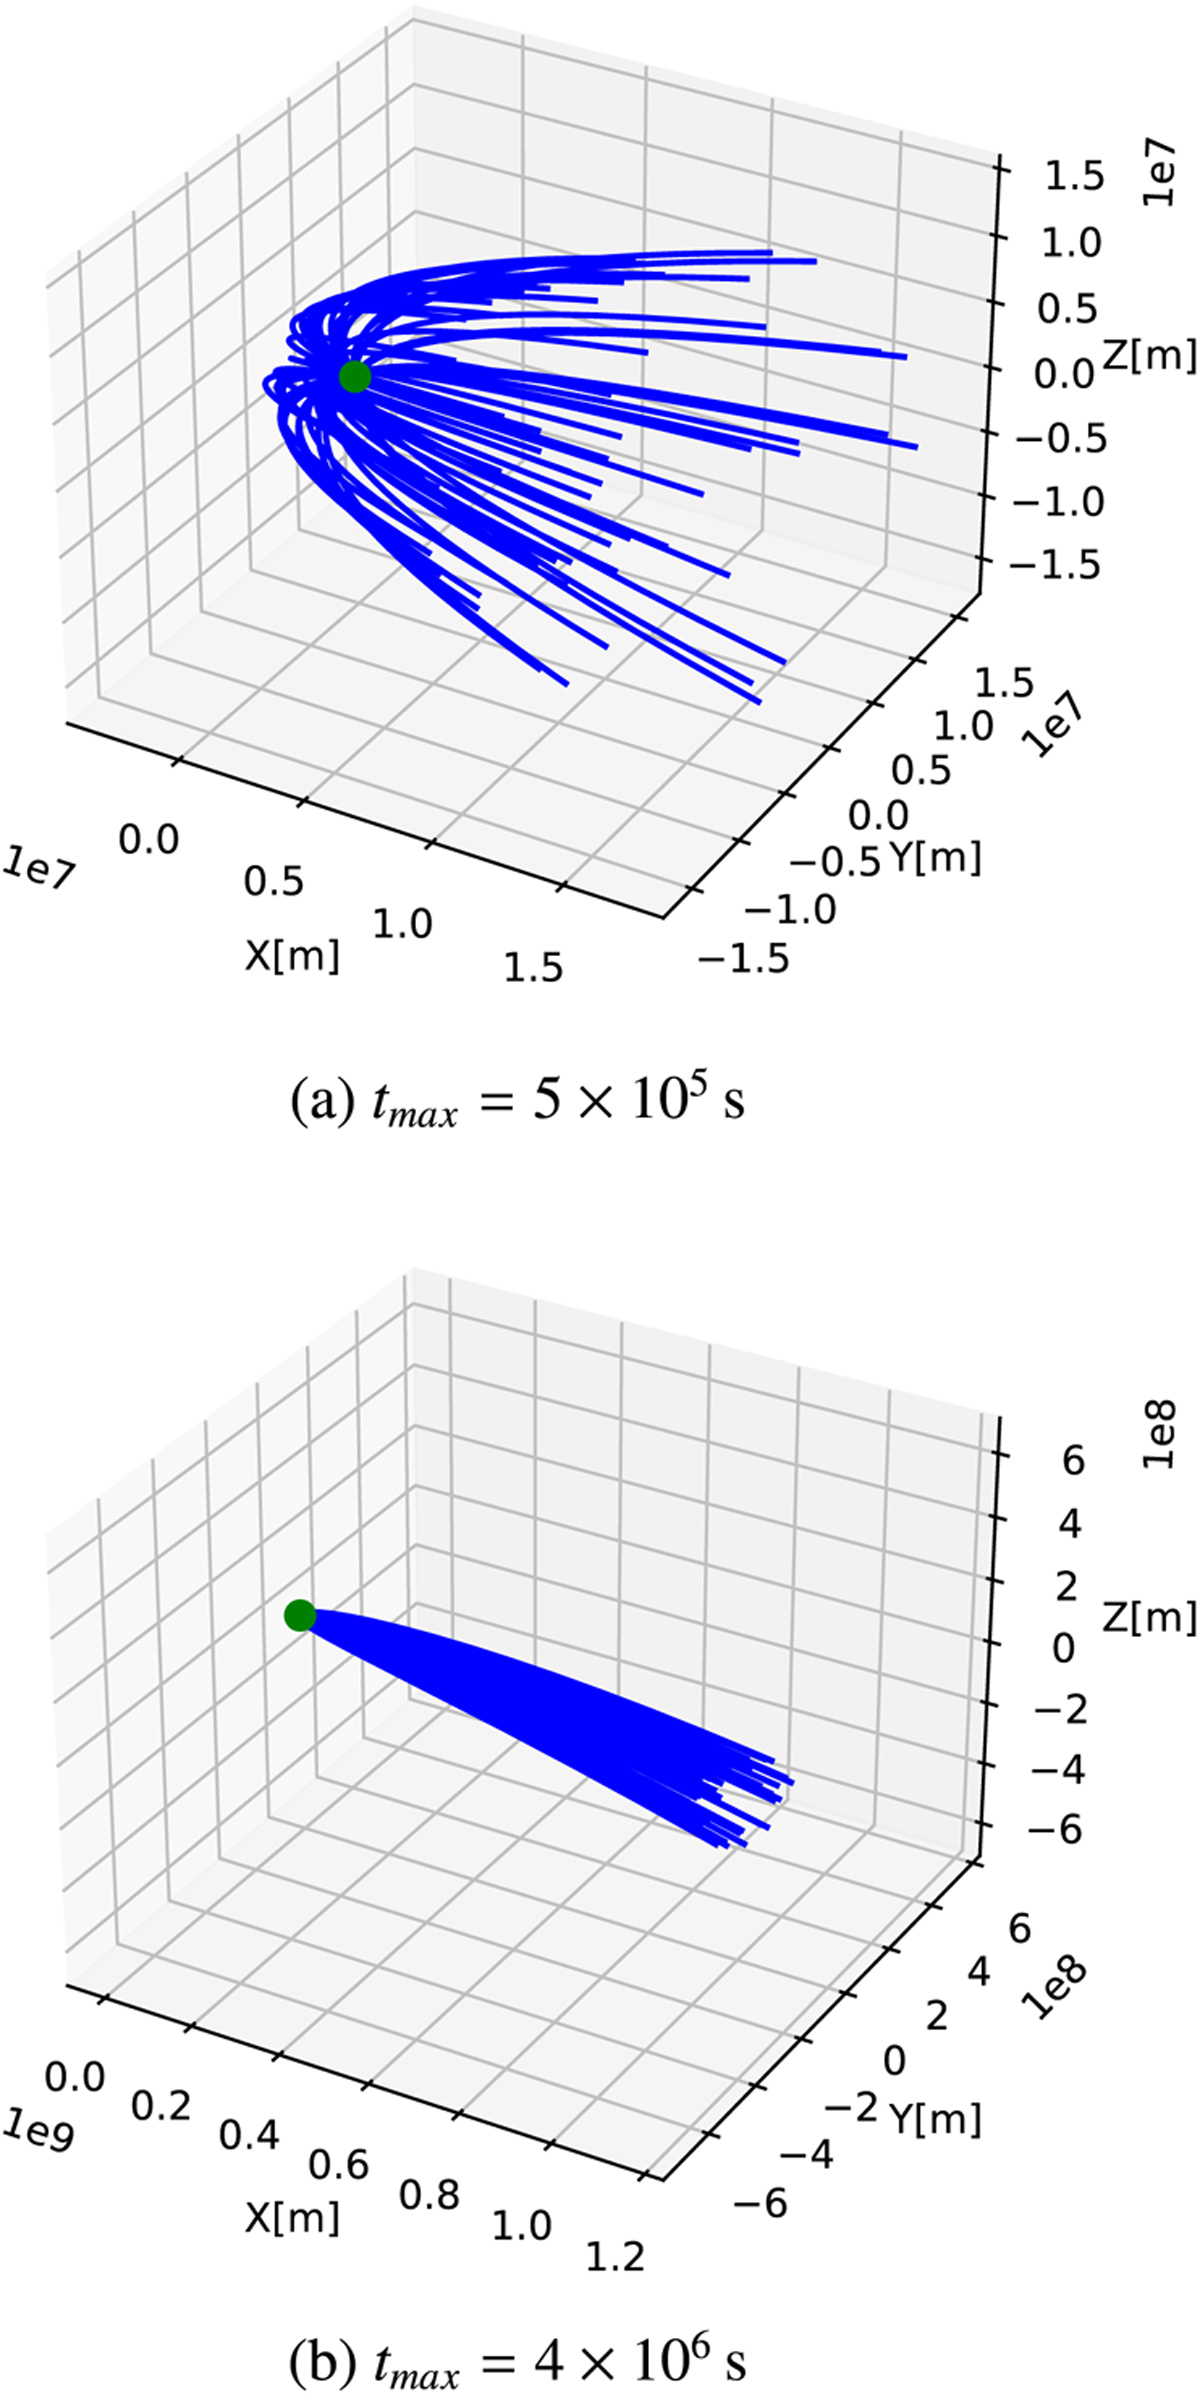
Fig. 2
Download original image
Calculated trajectories displayed in the rotating frame of reference of the comet. For visualization purposes we only display N = 64 starting points and restrict the starting points to the day side of the comet. The green dot represents the comet and is not to scale.
Current usage metrics show cumulative count of Article Views (full-text article views including HTML views, PDF and ePub downloads, according to the available data) and Abstracts Views on Vision4Press platform.
Data correspond to usage on the plateform after 2015. The current usage metrics is available 48-96 hours after online publication and is updated daily on week days.
Initial download of the metrics may take a while.