Fig. 4
Download original image
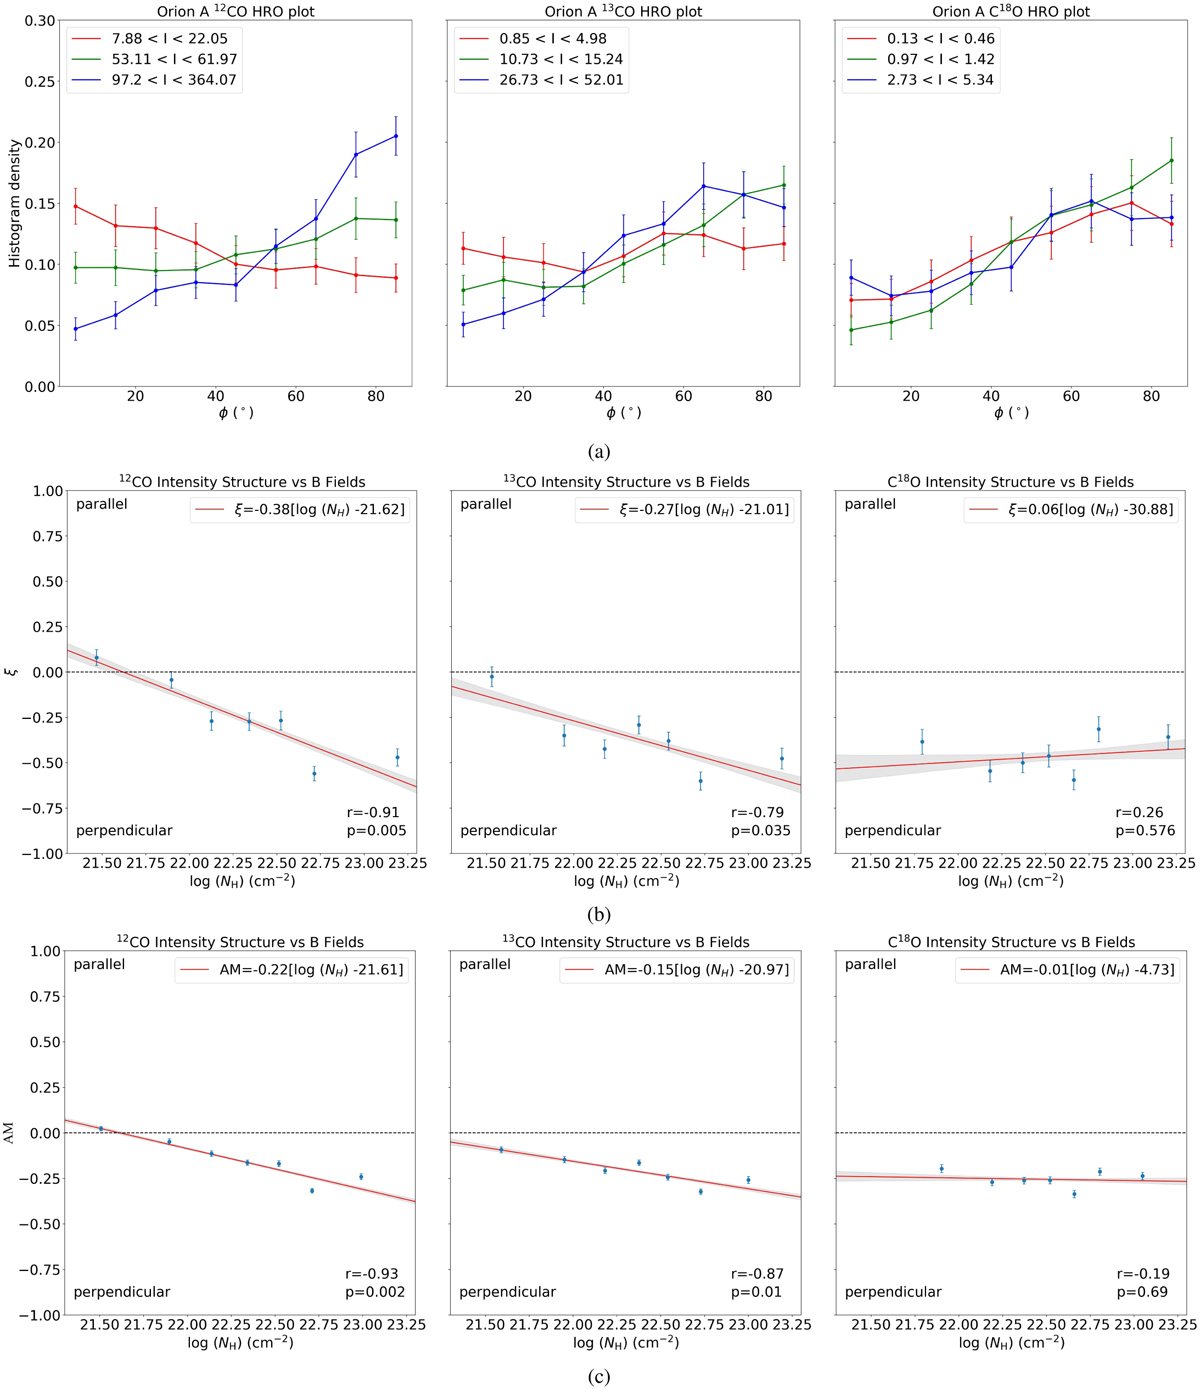
(a) Histogram of relative orientations between intensity structures for different tracers and magnetic field in the whole Orion A region. The red, green, and blue solid lines represent the angle distribution in the lowest, medium, and highest intensity bins, respectively. (b) Histogram shape parameter calculated in different column-density bins in the whole Orion A region. The red solid line is the optimal linear fitting results between ξ and column density. The gray area represents the 1σ confidence interval of the fitted line. (c) Same as b, but for the relation between AM and column density.
Current usage metrics show cumulative count of Article Views (full-text article views including HTML views, PDF and ePub downloads, according to the available data) and Abstracts Views on Vision4Press platform.
Data correspond to usage on the plateform after 2015. The current usage metrics is available 48-96 hours after online publication and is updated daily on week days.
Initial download of the metrics may take a while.