Fig. 5.
Download original image
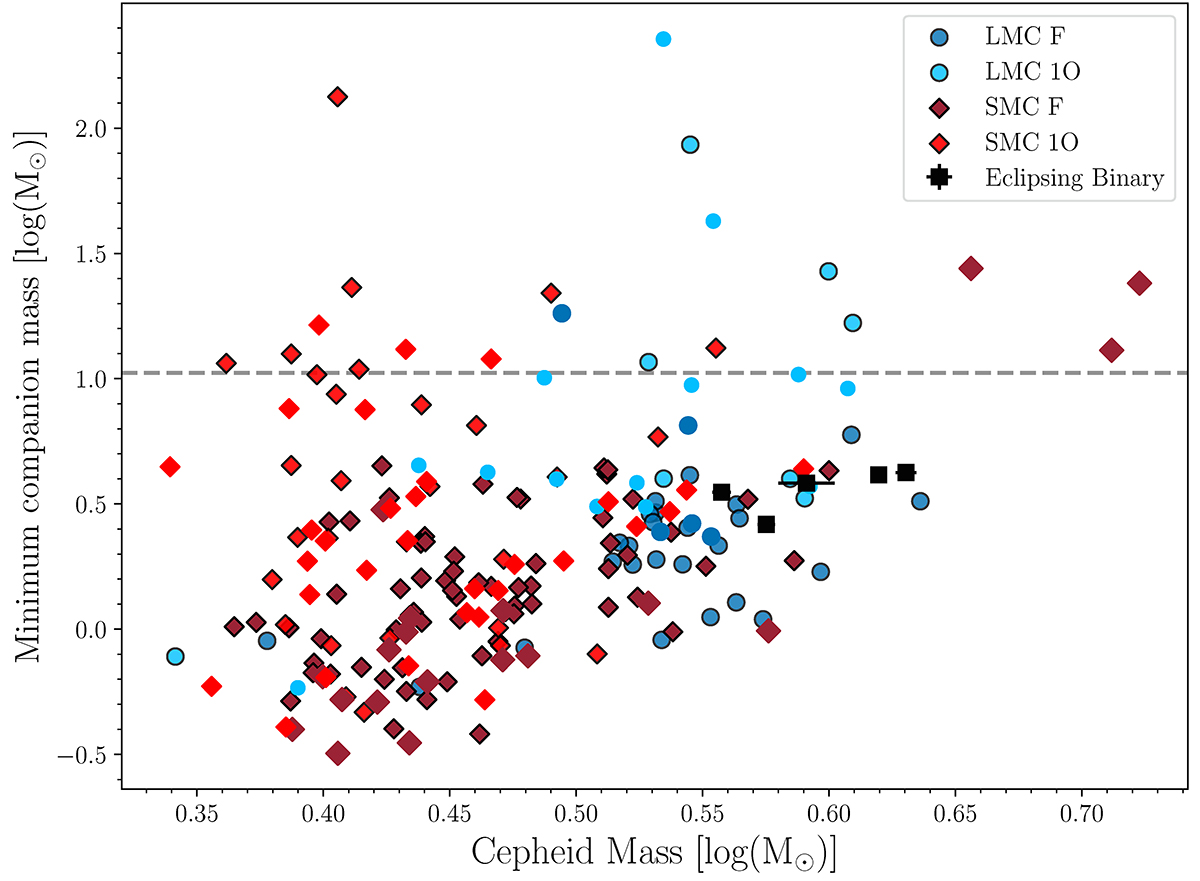
Distribution of estimated minimum companion masses as a function of derived Cepheid masses (see Sect. 4.3). The symbols represent Cepheids from the LMC F (blue circle), SMC F (brown diamond), LMC 1O (light blue circle) and SMC 1O (red diamond) samples. Symbols with black edges denote strong candidates whereas ones without denote marginal candidates. For comparison, we plot LMC Cepheid in eclipsing binaries (black filled square): OGLE-LMC-CEP-0227, OGLE-LMC-CEP-1718, OGLE-LMC-CEP-1812, OGLE-LMC-CEP-2532 and OGLE-LMC-CEP-4506 (Pilecki et al. 2018). The dashed gray line denotes two times the maximum Cepheid mass in the overall sample.
Current usage metrics show cumulative count of Article Views (full-text article views including HTML views, PDF and ePub downloads, according to the available data) and Abstracts Views on Vision4Press platform.
Data correspond to usage on the plateform after 2015. The current usage metrics is available 48-96 hours after online publication and is updated daily on week days.
Initial download of the metrics may take a while.