Fig. 2.
Download original image
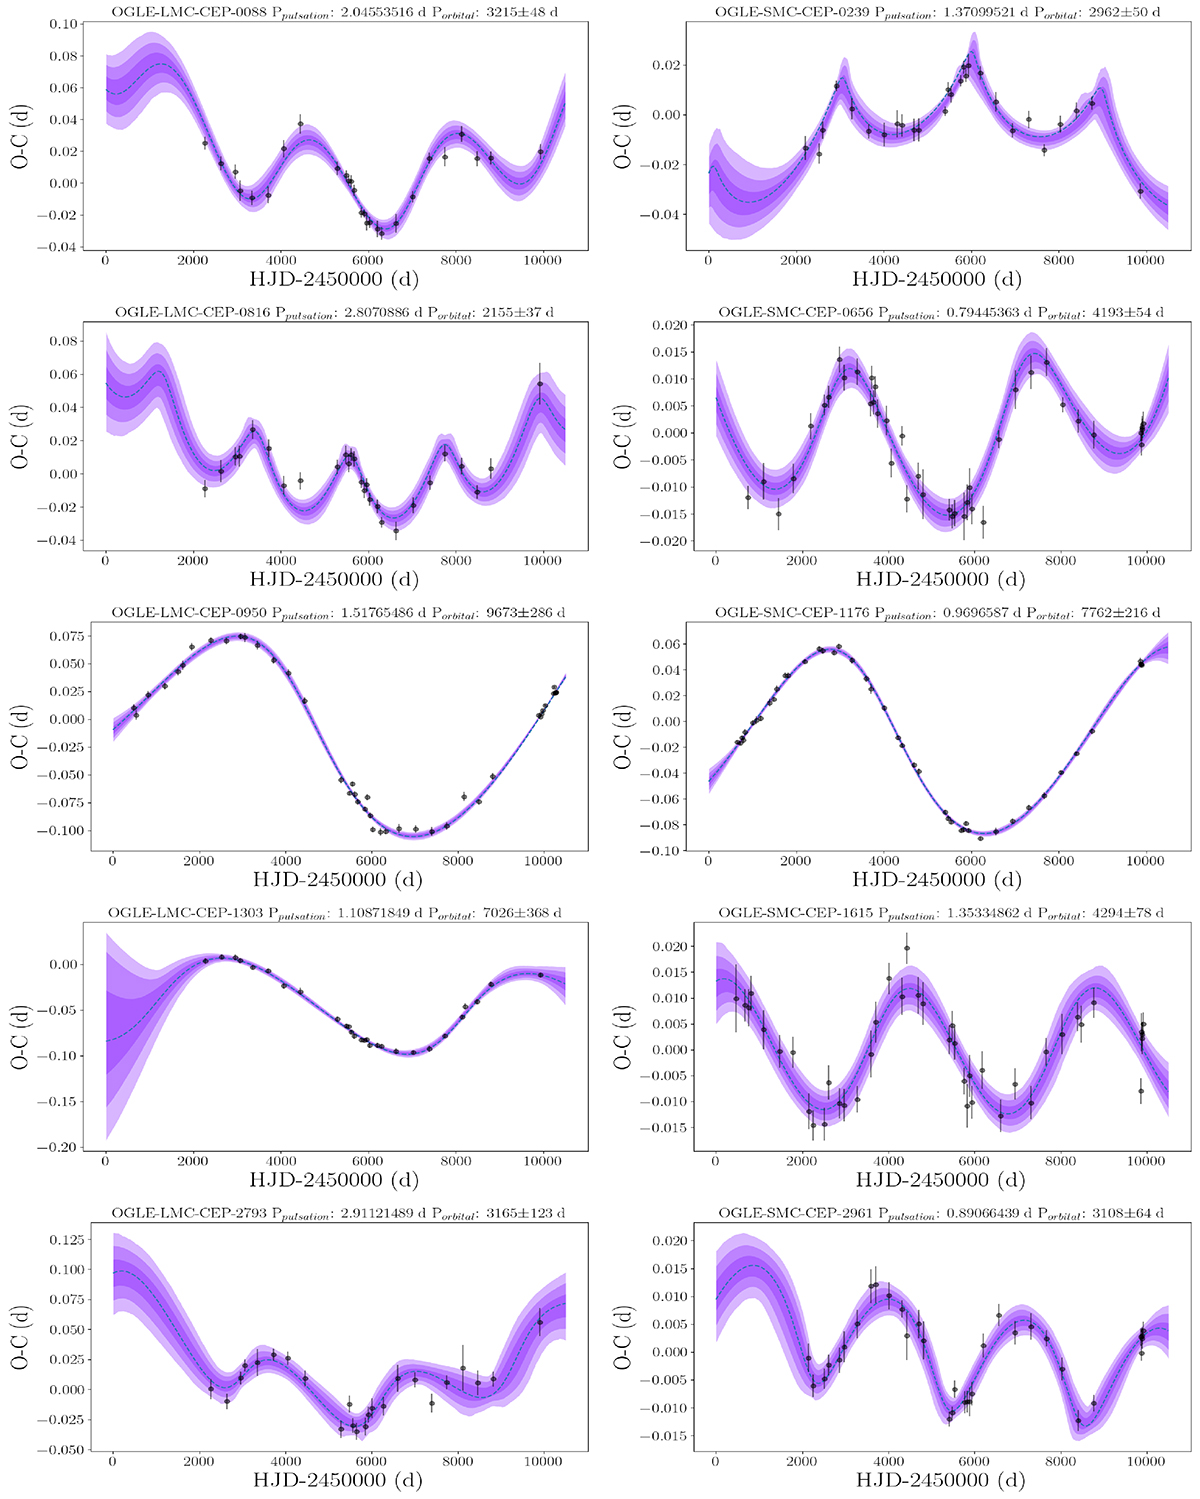
Examples of LMC first-overtone mode Cepheid binary candidate O–C diagrams over-plotted with their MCMC binary fit solutions (left). The blue dashed line represents the orbital solution obtained from the median parameter values of the posterior distribution. The purple-shaded regions imply one, two, and three standard deviations of the resulting MCMC fit in increasing transparency order. Above each panel the OGLE-ID, adopted pulsation period to construct the O–C diagram and the orbital period are shown. Same as above but for SMC first-overtone mode Cepheids (right). The remaining sample is presented in the appendix.
Current usage metrics show cumulative count of Article Views (full-text article views including HTML views, PDF and ePub downloads, according to the available data) and Abstracts Views on Vision4Press platform.
Data correspond to usage on the plateform after 2015. The current usage metrics is available 48-96 hours after online publication and is updated daily on week days.
Initial download of the metrics may take a while.