Fig. 6.
Download original image
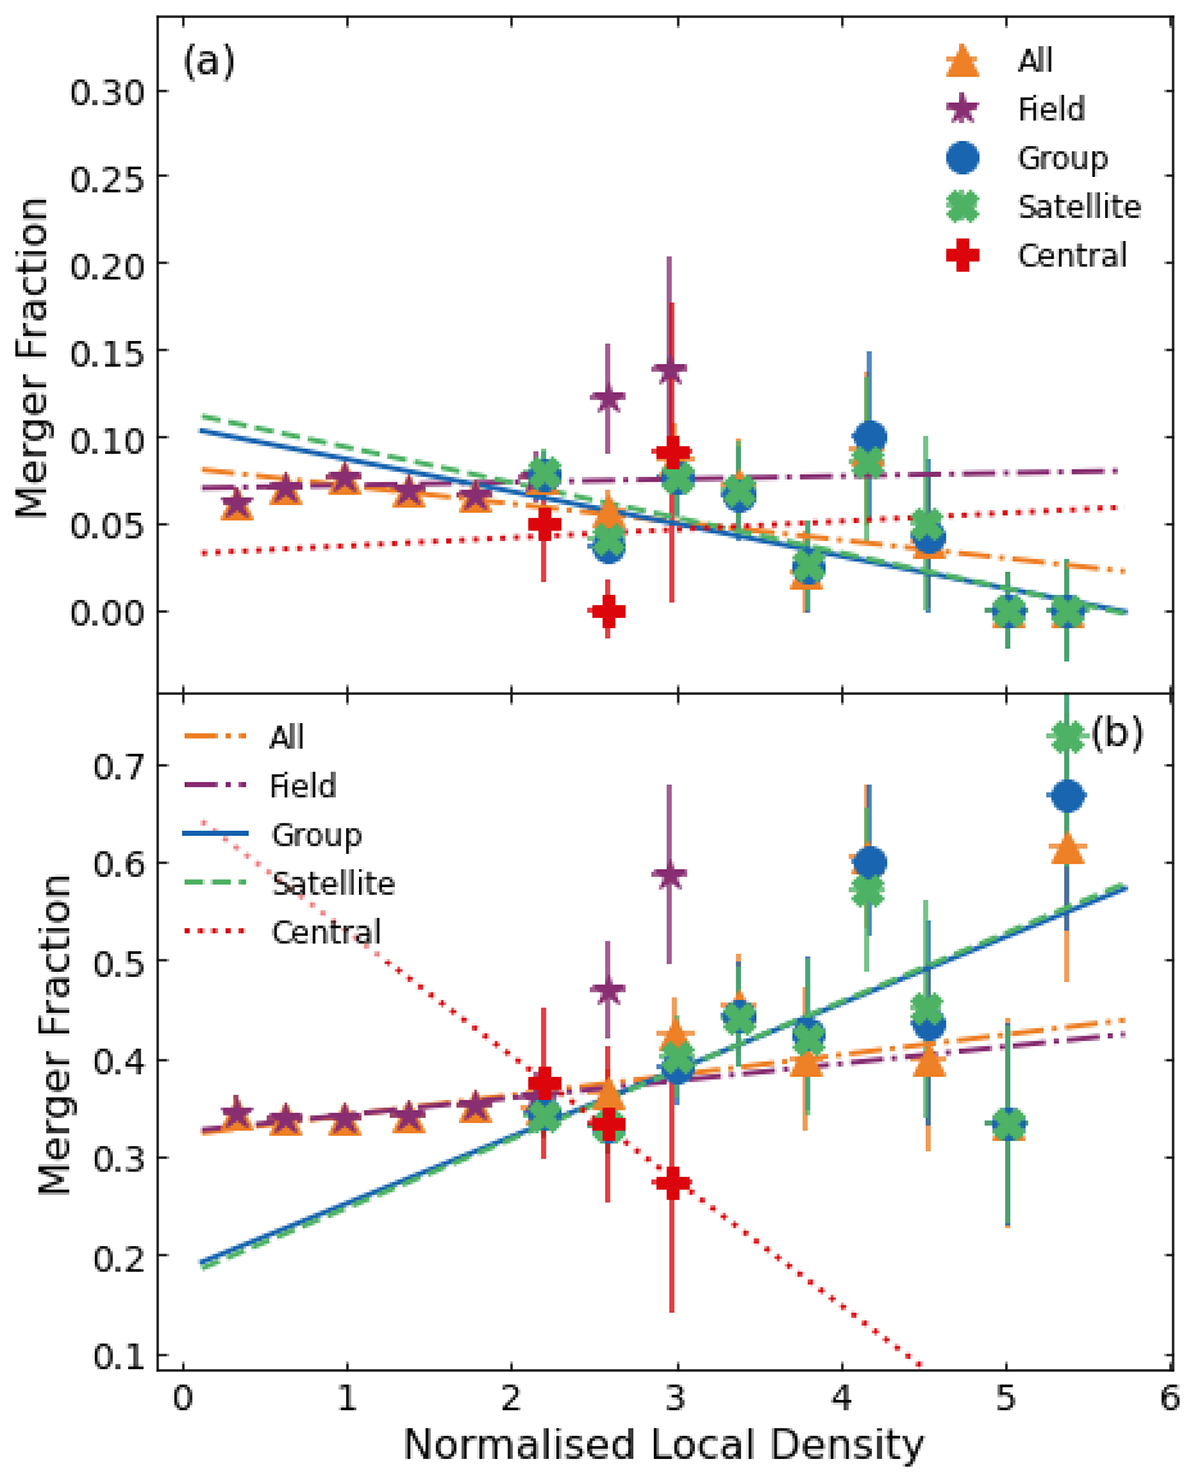
Merger fraction as a function of normalised local density for (a) visually confirmed mergers and (b) merger candidates. The entire galaxy sample (orange triangles), field galaxies (purple stars), group galaxies (blue circles), satellite galaxies (green crosses) and central galaxies (red pluses) are shown, along with their fitted linear trends. Best fit parameters can be found in Appendix B.
Current usage metrics show cumulative count of Article Views (full-text article views including HTML views, PDF and ePub downloads, according to the available data) and Abstracts Views on Vision4Press platform.
Data correspond to usage on the plateform after 2015. The current usage metrics is available 48-96 hours after online publication and is updated daily on week days.
Initial download of the metrics may take a while.