Fig. 8.
Download original image
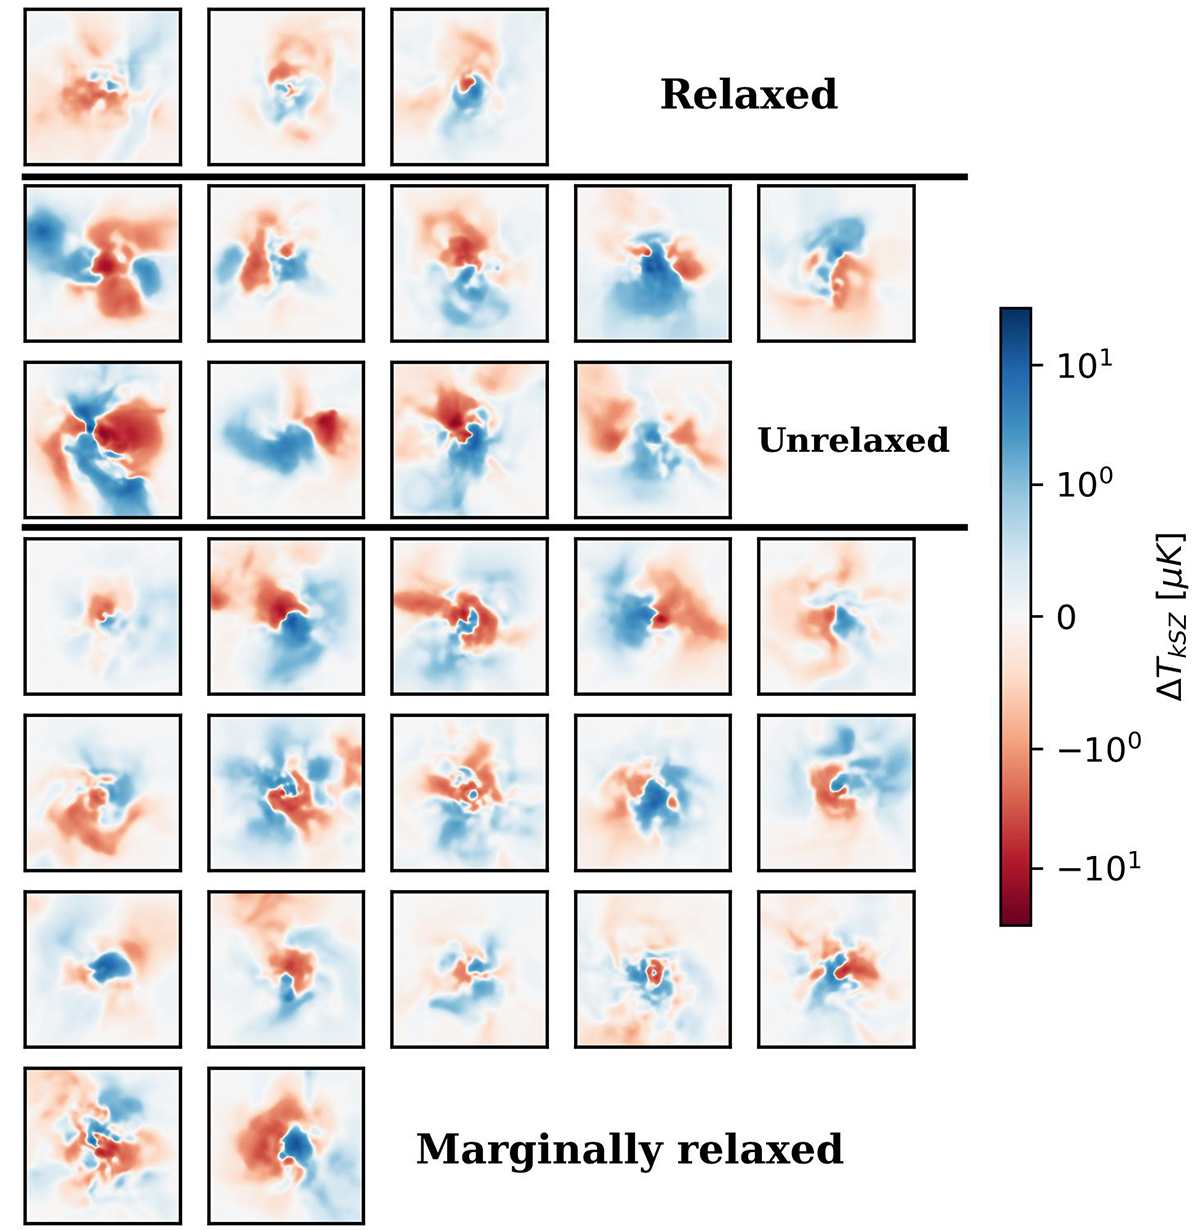
2 Rvir × 2 Rvir maps of the kSZ effect for every cluster with Mvir > 1014 M⊙ at z = 0. The pixel size in the images is 9 kpc, coinciding with the highest numerical resolution in the simulation. The maps are centred on the cluster density peak. The relaxed clusters are on top, the unrelaxed in the middle and the marginally relaxed are below. Colours display temperature variations according with the palette on the right.
Current usage metrics show cumulative count of Article Views (full-text article views including HTML views, PDF and ePub downloads, according to the available data) and Abstracts Views on Vision4Press platform.
Data correspond to usage on the plateform after 2015. The current usage metrics is available 48-96 hours after online publication and is updated daily on week days.
Initial download of the metrics may take a while.