Open Access
Fig. 6.
Download original image
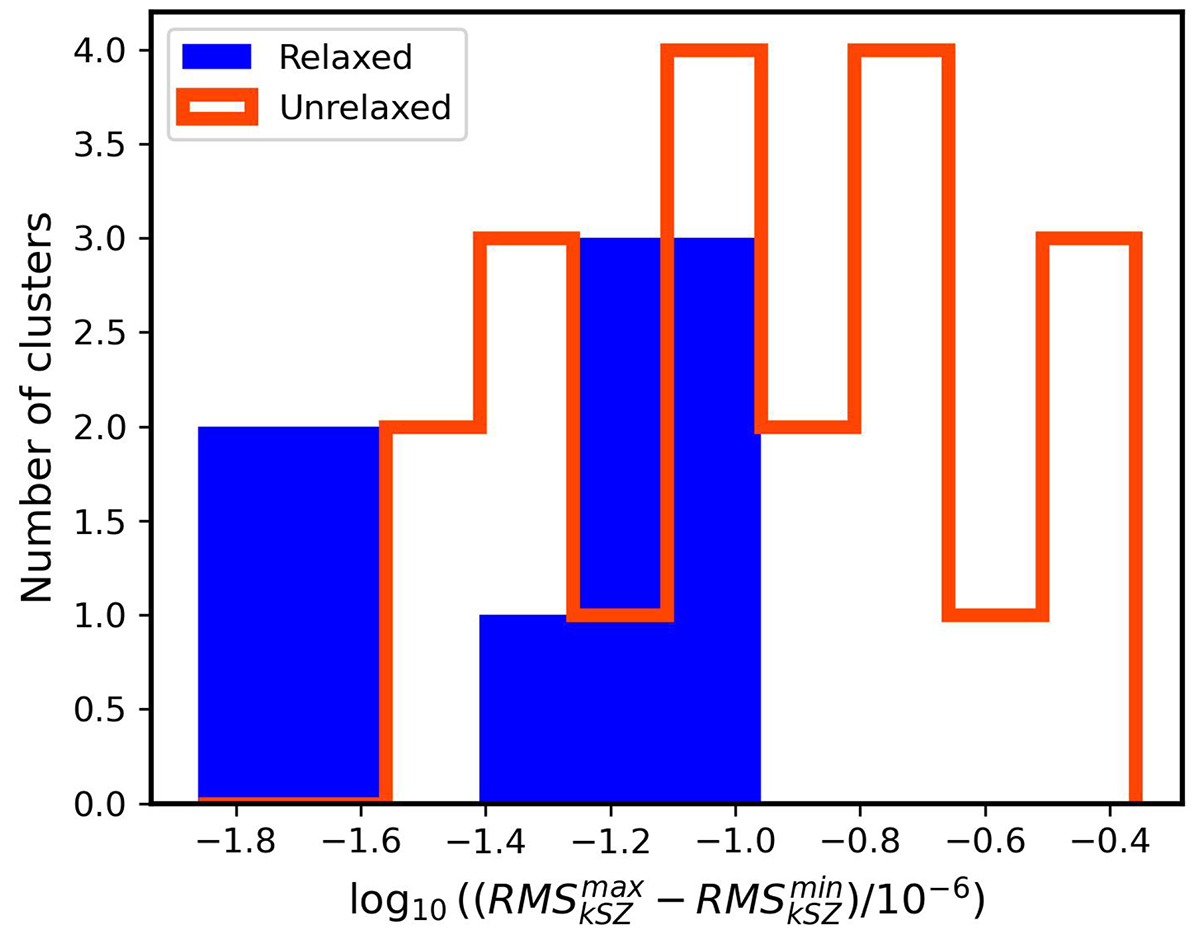
Histogram of the number of clusters of each dynamical state class against the logarithmic difference between the maximum and minimum values of the RMS of the kSZ effect obtained with the three projections XY, XZ and YZ.
Current usage metrics show cumulative count of Article Views (full-text article views including HTML views, PDF and ePub downloads, according to the available data) and Abstracts Views on Vision4Press platform.
Data correspond to usage on the plateform after 2015. The current usage metrics is available 48-96 hours after online publication and is updated daily on week days.
Initial download of the metrics may take a while.