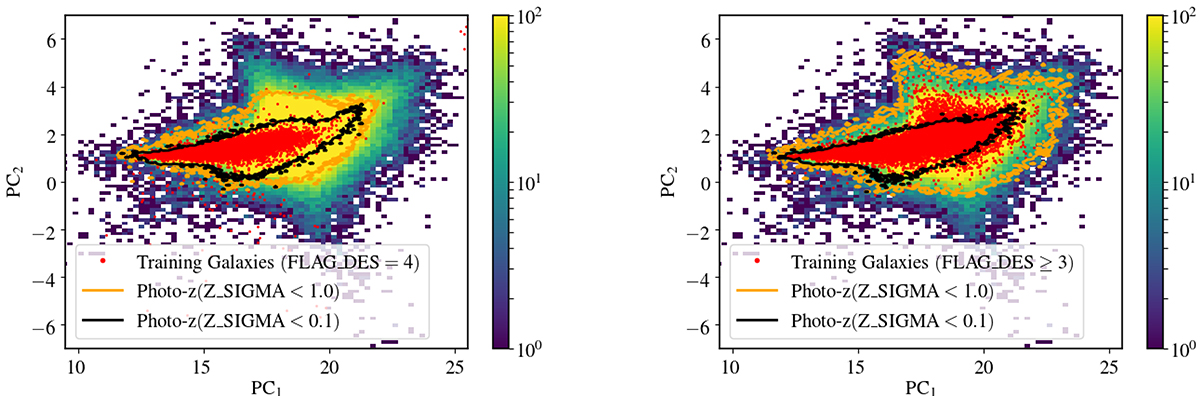
Fig. 8.
Download original image
Density map as a function of the first and second principal components of the galaxies of Y3 DES Deep Fields (density plot in green and yellow), the galaxies of the training sample (red dots), and the limit in the principal components of the galaxies for which DNF provides a value of photo-z with an uncertainty, DNF_ZSIGMA < 1.0 (orange line) and DNF_ZSIGMA < 0.1 (bold black line), with this training sample. The red blob is less extensive than the green-yellow blob (where the highest density of galaxies is located) when we select only the galaxies with FLAG_DES = 4.
Current usage metrics show cumulative count of Article Views (full-text article views including HTML views, PDF and ePub downloads, according to the available data) and Abstracts Views on Vision4Press platform.
Data correspond to usage on the plateform after 2015. The current usage metrics is available 48-96 hours after online publication and is updated daily on week days.
Initial download of the metrics may take a while.