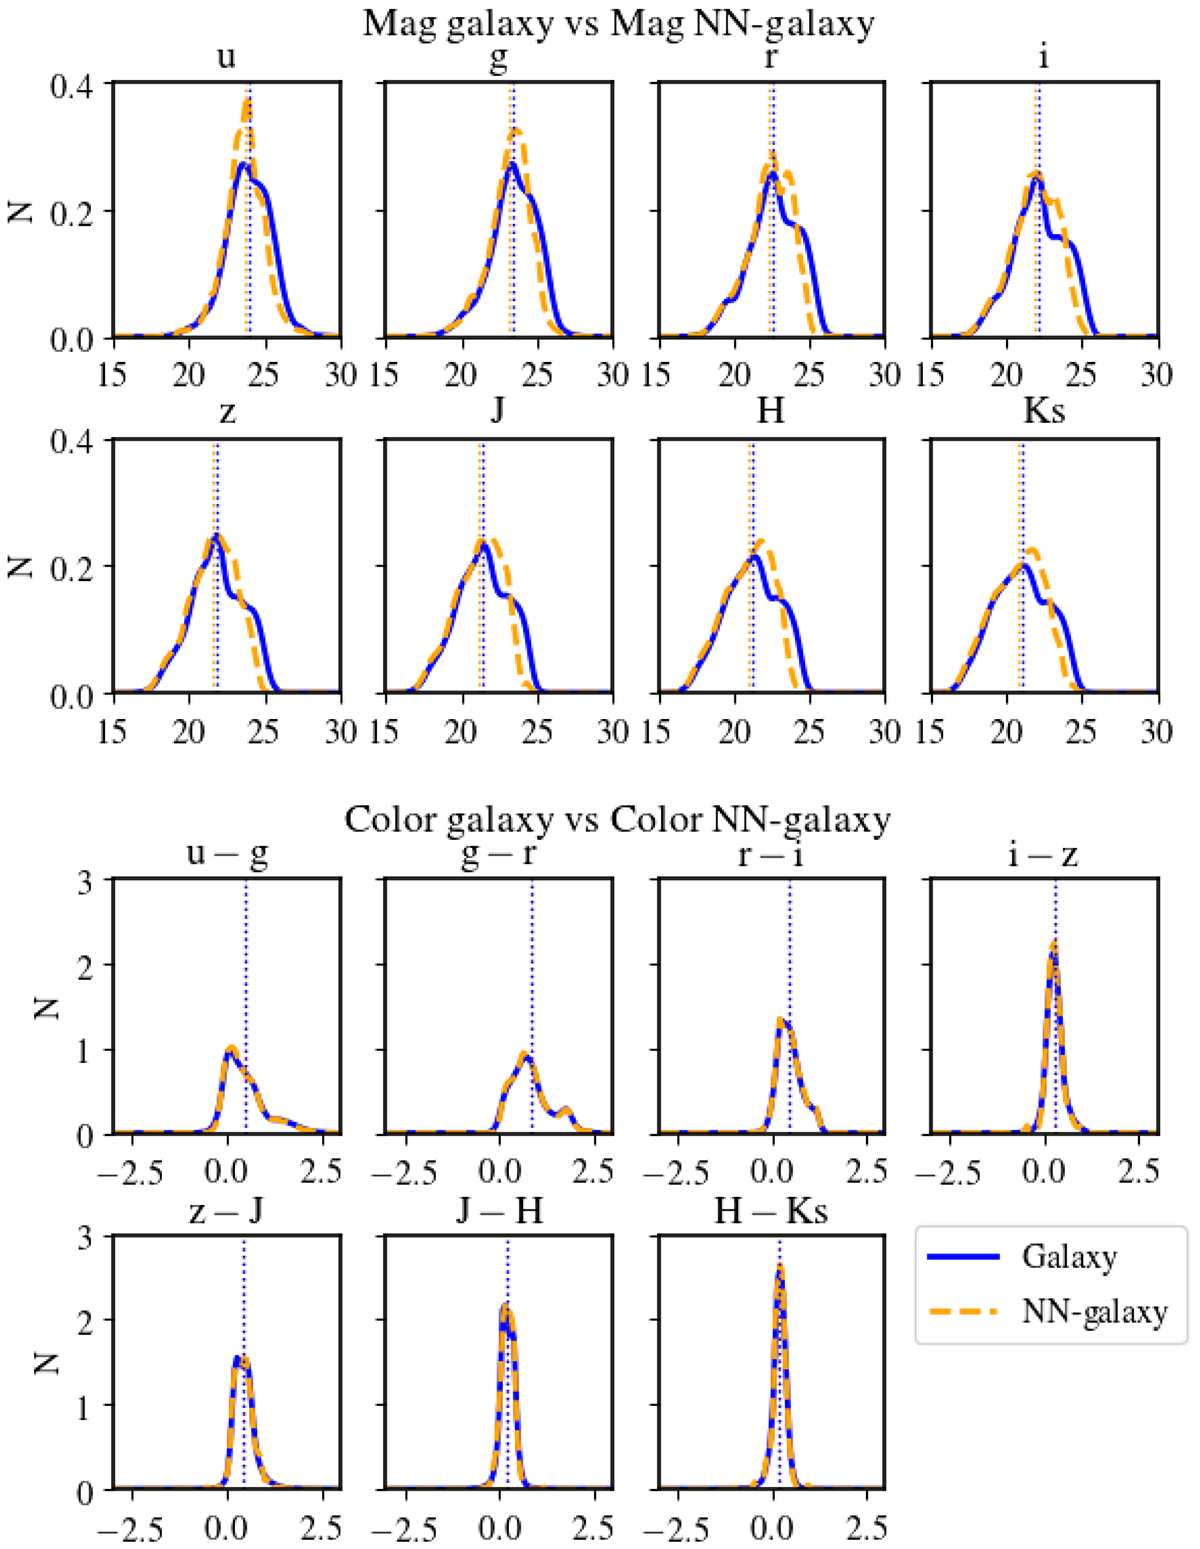
Fig. 2.
Download original image
Magnitude and colour distribution of the nearest-neighbour galaxies used in the estimation of photo-z in the incomplete training and the validation sample. The dashed orange lines represent the nearest-neighbour galaxies’ distribution in incomplete training and the blue lines the distribution in the validation sample. The dotted vertical lines are the mean of each distribution. We have not included the distributions of the complete training sample since they overlap perfectly with those of the validation sample.
Current usage metrics show cumulative count of Article Views (full-text article views including HTML views, PDF and ePub downloads, according to the available data) and Abstracts Views on Vision4Press platform.
Data correspond to usage on the plateform after 2015. The current usage metrics is available 48-96 hours after online publication and is updated daily on week days.
Initial download of the metrics may take a while.