Fig. 6
Download original image
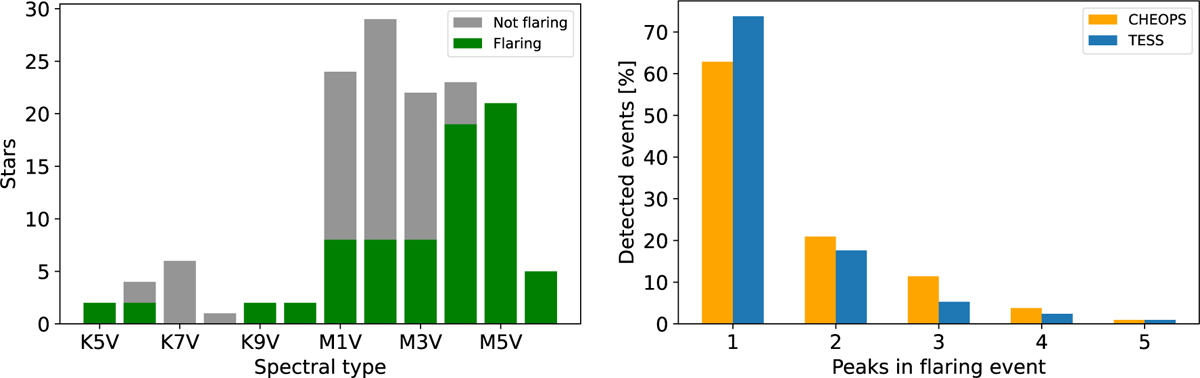
Flare detection statistics. Left: number of flaring and non-flaring stars as a function of spectral type. Right: percentages of peaks observed per flare event. Flares observed with CHEOPS and TESS are distinguished.
Current usage metrics show cumulative count of Article Views (full-text article views including HTML views, PDF and ePub downloads, according to the available data) and Abstracts Views on Vision4Press platform.
Data correspond to usage on the plateform after 2015. The current usage metrics is available 48-96 hours after online publication and is updated daily on week days.
Initial download of the metrics may take a while.