Fig. 5
Download original image
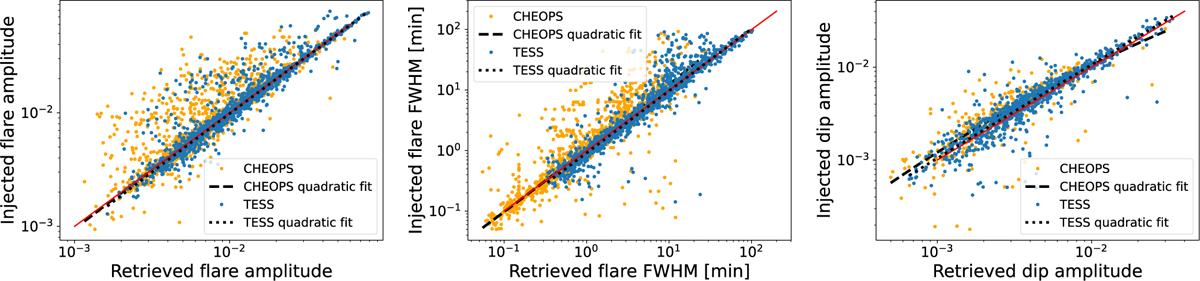
Retrieved versus input parameters used in the injection tests. The one-to-one relationship is highlighted with red lines, and quadratic polynomial fits for the CHEOPS and TESS data are plotted as dashed and dotted black lines, respectively.
Current usage metrics show cumulative count of Article Views (full-text article views including HTML views, PDF and ePub downloads, according to the available data) and Abstracts Views on Vision4Press platform.
Data correspond to usage on the plateform after 2015. The current usage metrics is available 48-96 hours after online publication and is updated daily on week days.
Initial download of the metrics may take a while.