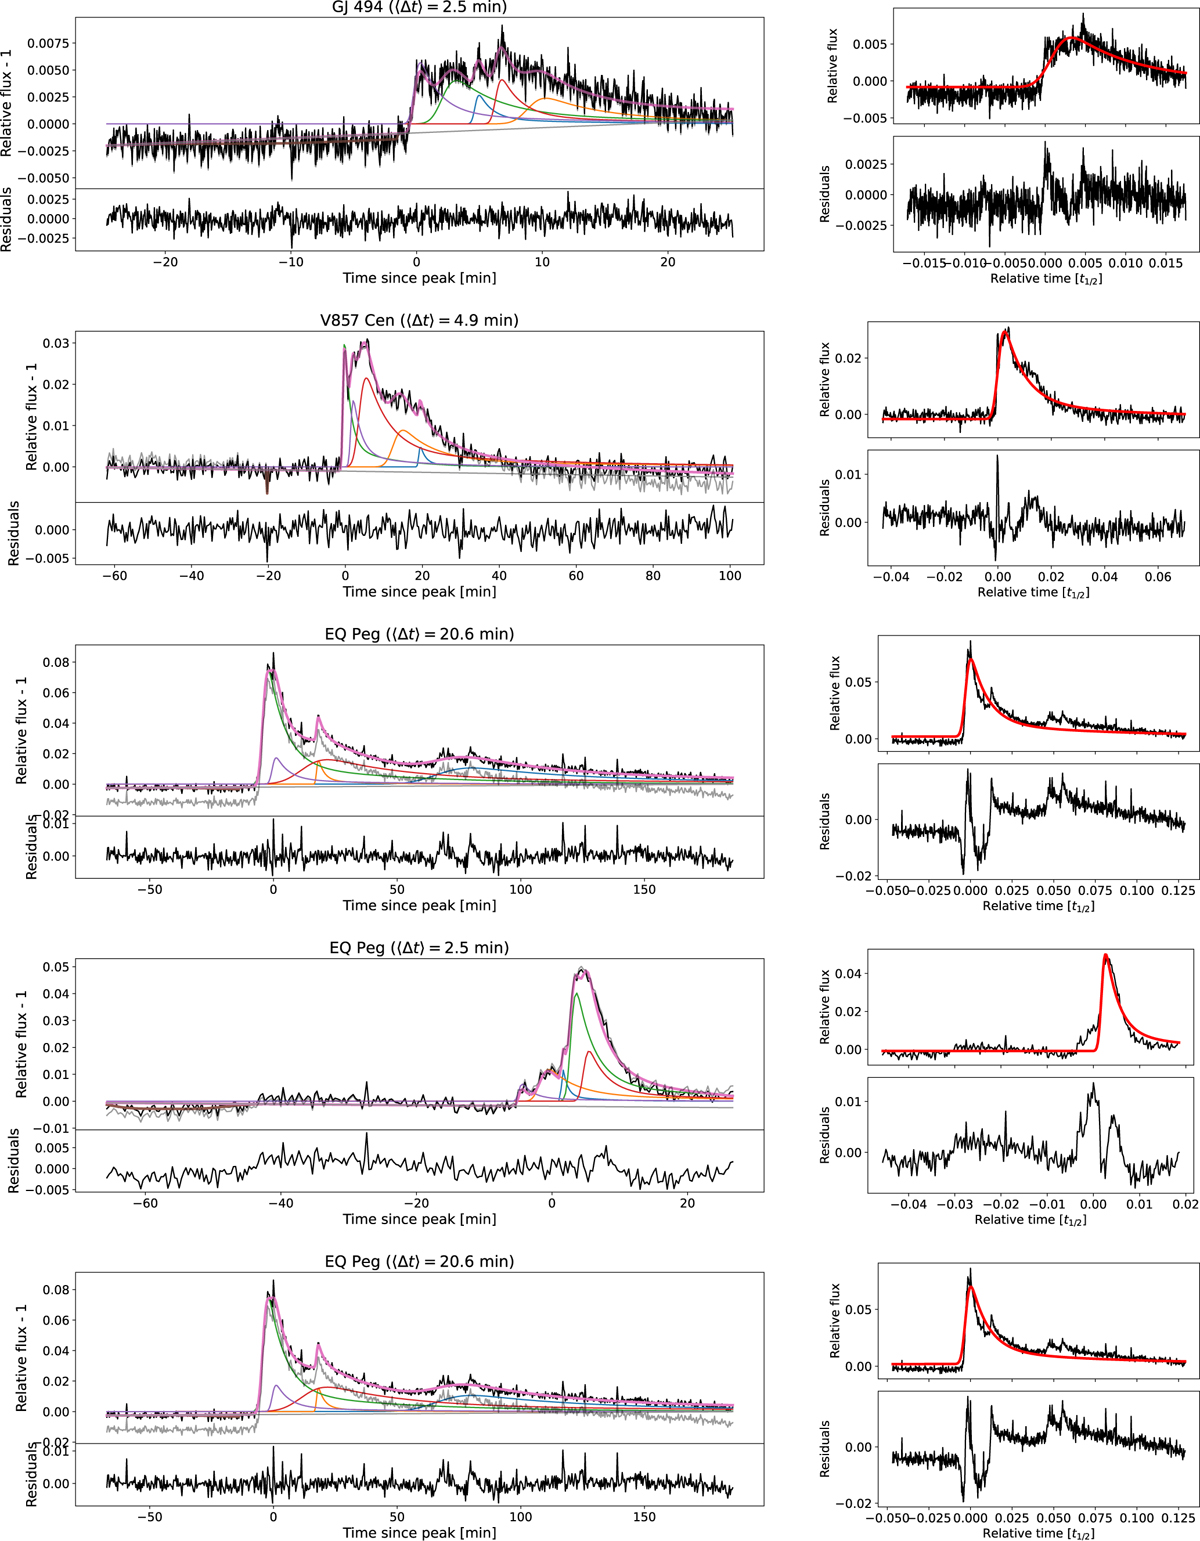
Fig. B.1
Download original image
QPP candidates not shown in the main text. Each row represents a different candidate, and its description is the same as in Figure 19 (first part).
The fourth candidate in this Figure (observed on AD Leo) was not used for the calculation of the median flare residual periodicity (Section 6.7), because of its associated poor fit.
Current usage metrics show cumulative count of Article Views (full-text article views including HTML views, PDF and ePub downloads, according to the available data) and Abstracts Views on Vision4Press platform.
Data correspond to usage on the plateform after 2015. The current usage metrics is available 48-96 hours after online publication and is updated daily on week days.
Initial download of the metrics may take a while.