Fig. 19
Download original image
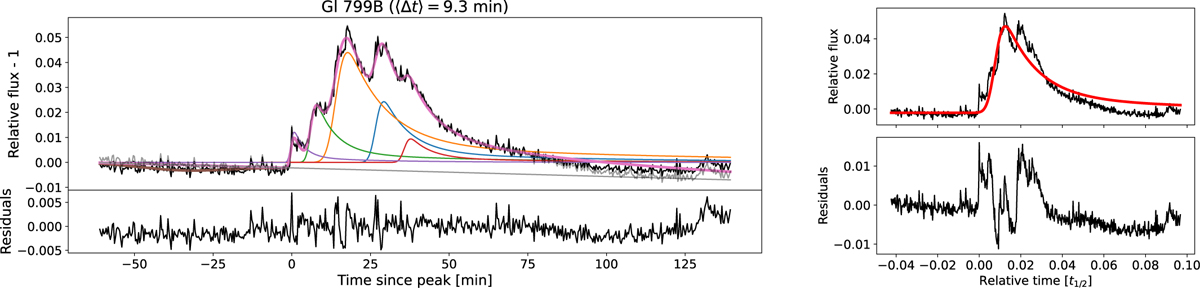
QPP candidate on Gl 799 B. Left: the mean time between consecutive peaks is reported in the title. This QPP candidate is probably the same one reported by Howard & MacGregor (2022; their Fig. 7, left panel), for which we recover a similar period to their ≃7.5 min. The individual flare components that were identified by our algorithm are drawn with different colours, and the total model is represented with a thick line. Right: on the top sub-panel, fit to the flare profile with a single-peak model. On the lower sub-panel, the residuals used to estimate the oscillation amplitude.
Current usage metrics show cumulative count of Article Views (full-text article views including HTML views, PDF and ePub downloads, according to the available data) and Abstracts Views on Vision4Press platform.
Data correspond to usage on the plateform after 2015. The current usage metrics is available 48-96 hours after online publication and is updated daily on week days.
Initial download of the metrics may take a while.