Fig. 12
Download original image
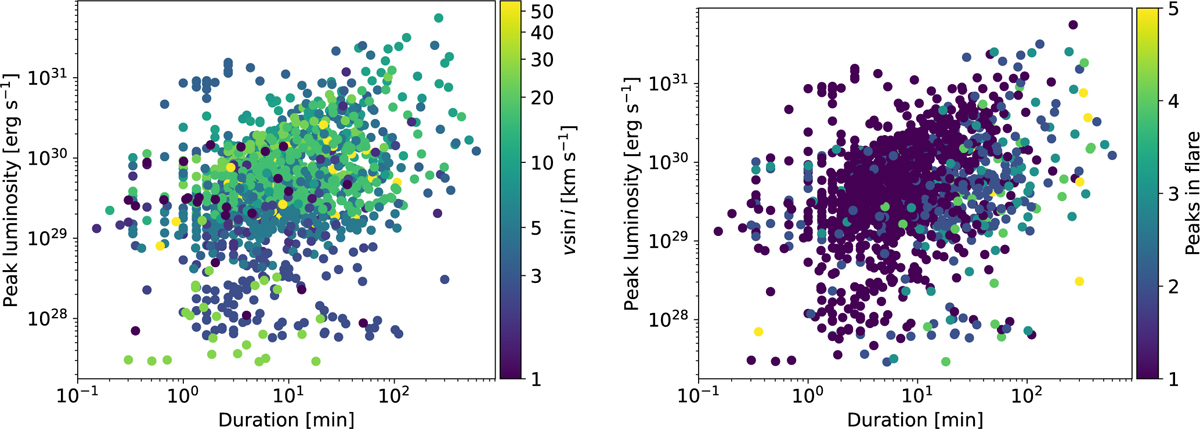
Flare parameter trends. Left: relationship between flare luminosity and duration, where the stellar υ sin i is represented with the marker colour. Right: same relationship, where the flare complexity is represented with the marker colour. We remind that each point represents a single outburst even in a multi-peak flare, so that the colour refers to the complexity of the event each data point belongs to.
Current usage metrics show cumulative count of Article Views (full-text article views including HTML views, PDF and ePub downloads, according to the available data) and Abstracts Views on Vision4Press platform.
Data correspond to usage on the plateform after 2015. The current usage metrics is available 48-96 hours after online publication and is updated daily on week days.
Initial download of the metrics may take a while.