Open Access
Fig. 8
Download original image
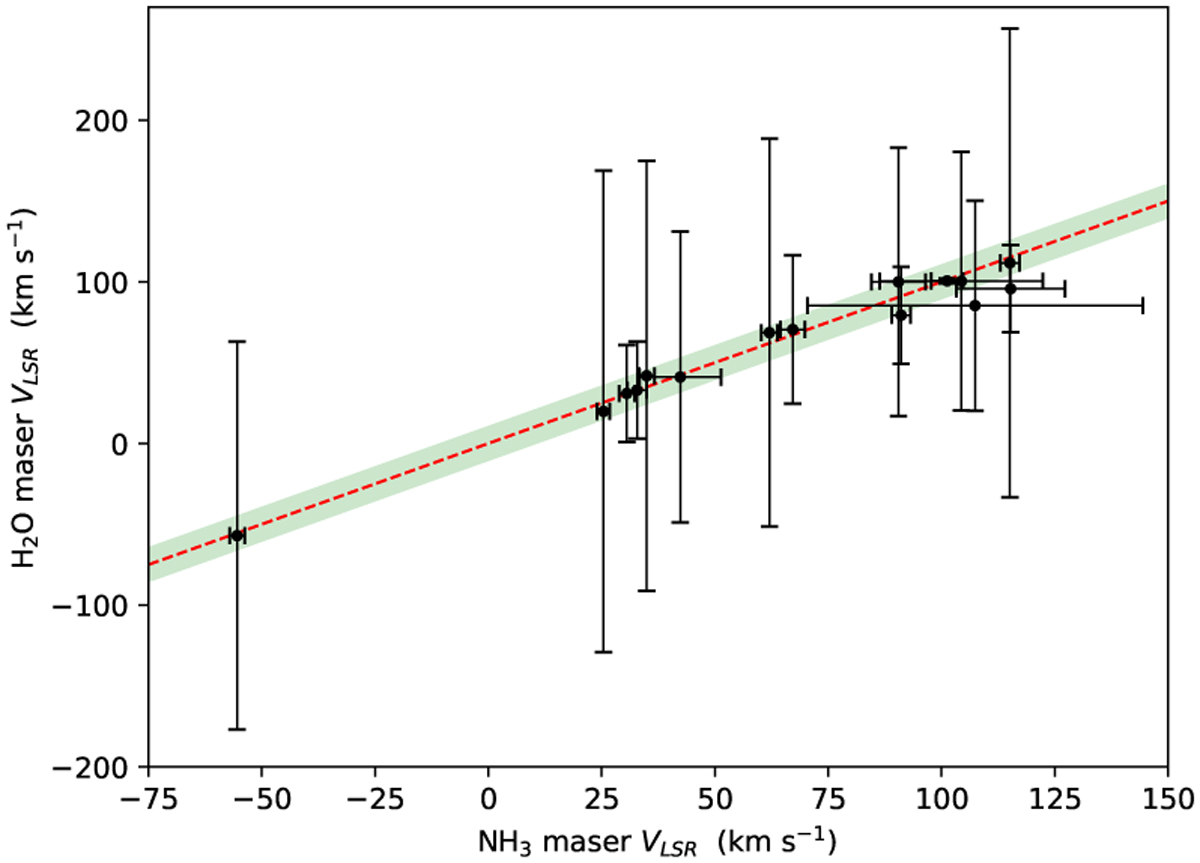
Comparison of the velocity ranges of NH3 and H2O masers. Dots indicate the velocities of bright NH3 and H2O maser features. Error bars show the velocity ranges in detected NH3 and H2O masers. The dashed line marks locations where the velocity of NH3 equals that of a water maser. The green region shows the ± 10 km s−1 zone.
Current usage metrics show cumulative count of Article Views (full-text article views including HTML views, PDF and ePub downloads, according to the available data) and Abstracts Views on Vision4Press platform.
Data correspond to usage on the plateform after 2015. The current usage metrics is available 48-96 hours after online publication and is updated daily on week days.
Initial download of the metrics may take a while.