Open Access
Fig. 8
Download original image
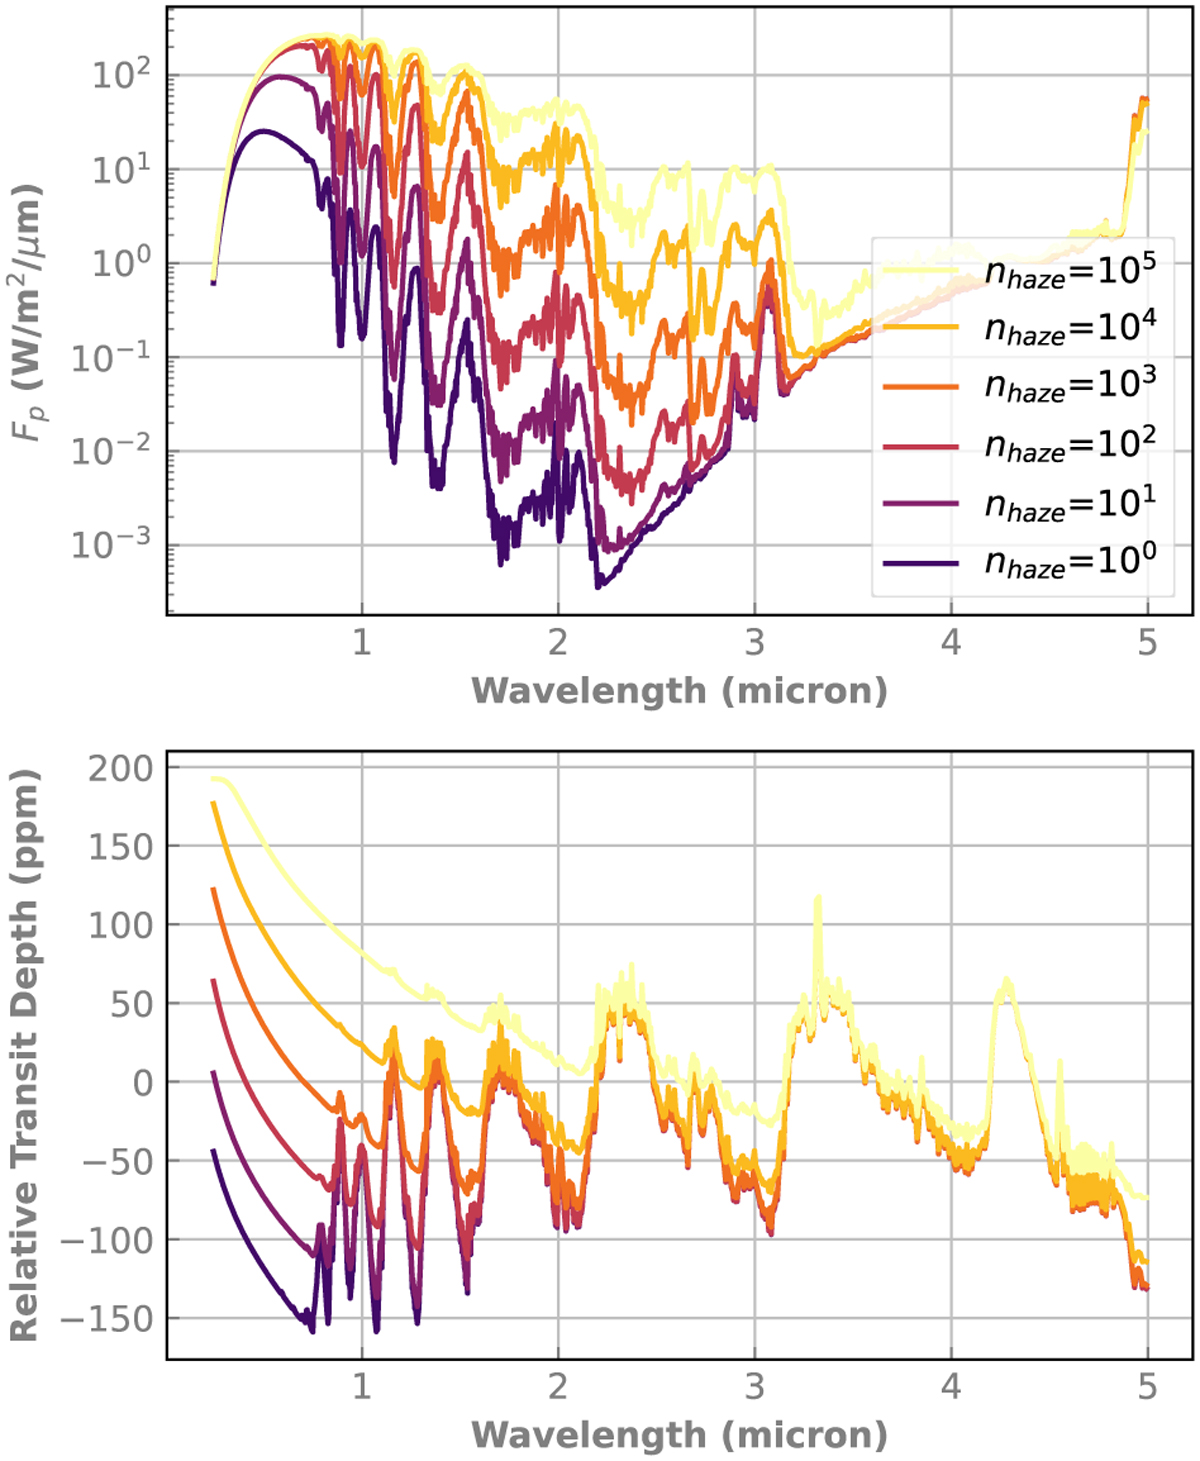
Eclipse (top) and transit (bottom) spectra of our models of K2-18 b with hazes parametrized through the nhaze factor (see the main text). One can see that when the amount of haze increases, the amount of reflected light (hence the albedo) increases but the amplitude of the methane bands in the transit spectrum decreases.
Current usage metrics show cumulative count of Article Views (full-text article views including HTML views, PDF and ePub downloads, according to the available data) and Abstracts Views on Vision4Press platform.
Data correspond to usage on the plateform after 2015. The current usage metrics is available 48-96 hours after online publication and is updated daily on week days.
Initial download of the metrics may take a while.