Fig. 5
Download original image
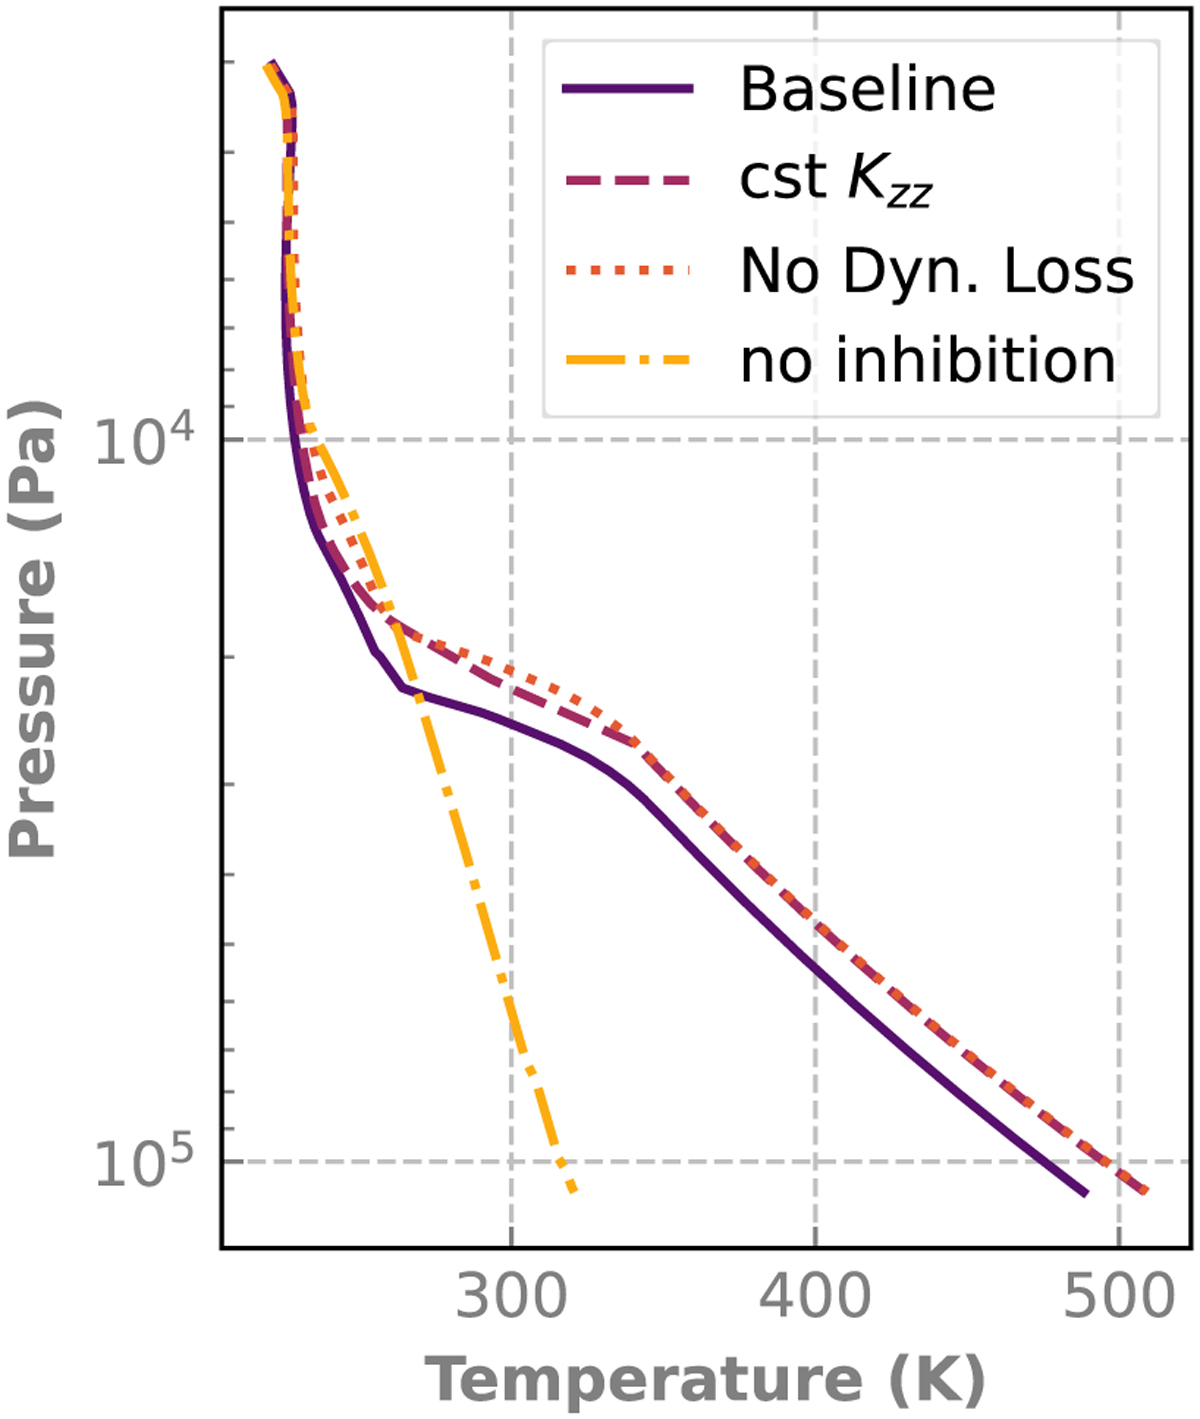
Sensitivity analysis showing the impact of various assumptions on the equilibrated temperature profile. The solid curve is the baseline profiles, the dashed one shows the case with a constant eddy diffusivity, and the dotted one shows the effect of correcting for the dynamical losses. Differences between the various cases are much smaller than the effect of convection inhibition itself, which can be seen by comparing with the no-inhibition case (dash-dotted curve).
Current usage metrics show cumulative count of Article Views (full-text article views including HTML views, PDF and ePub downloads, according to the available data) and Abstracts Views on Vision4Press platform.
Data correspond to usage on the plateform after 2015. The current usage metrics is available 48-96 hours after online publication and is updated daily on week days.
Initial download of the metrics may take a while.