Fig. 4
Download original image
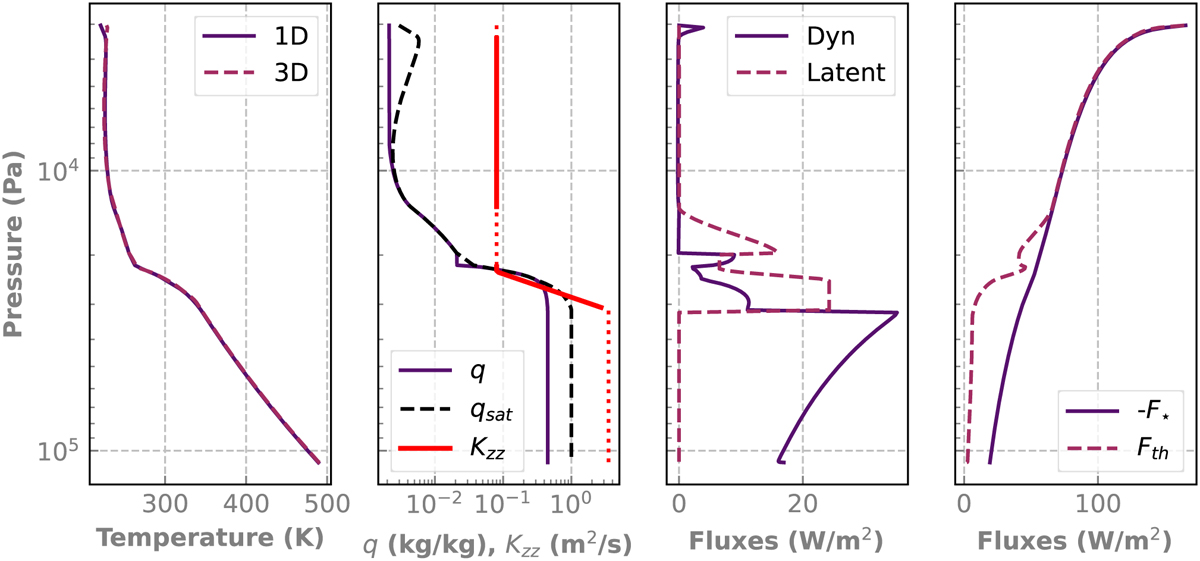
Atmospheric structure of the 1D model for the baseline case. From left to right: temperature, water vapor specific concentration, dynamical fluxes, and radiative flux vertical profiles. The dashed curve in the temperature panel shows the average 3D thermal profile for comparison. In the second panel, the dashed line shows the value of the saturation concentration ratio and the red curve shows the profile of eddy diffusivity. Dots show the convective zone, where the value of the diffusivity is irrelevant because mixing is not diffusive. The third panel can be compared to Fig. 2. The last panel shows (minus) the net upward incoming stellar flux (solid) and the net outgoing thermal flux emitted by the atmosphere (dashed). This panel shows that most of the radiative cooling to space occurs in the stable layer and above.
Current usage metrics show cumulative count of Article Views (full-text article views including HTML views, PDF and ePub downloads, according to the available data) and Abstracts Views on Vision4Press platform.
Data correspond to usage on the plateform after 2015. The current usage metrics is available 48-96 hours after online publication and is updated daily on week days.
Initial download of the metrics may take a while.