Fig. 3
Download original image
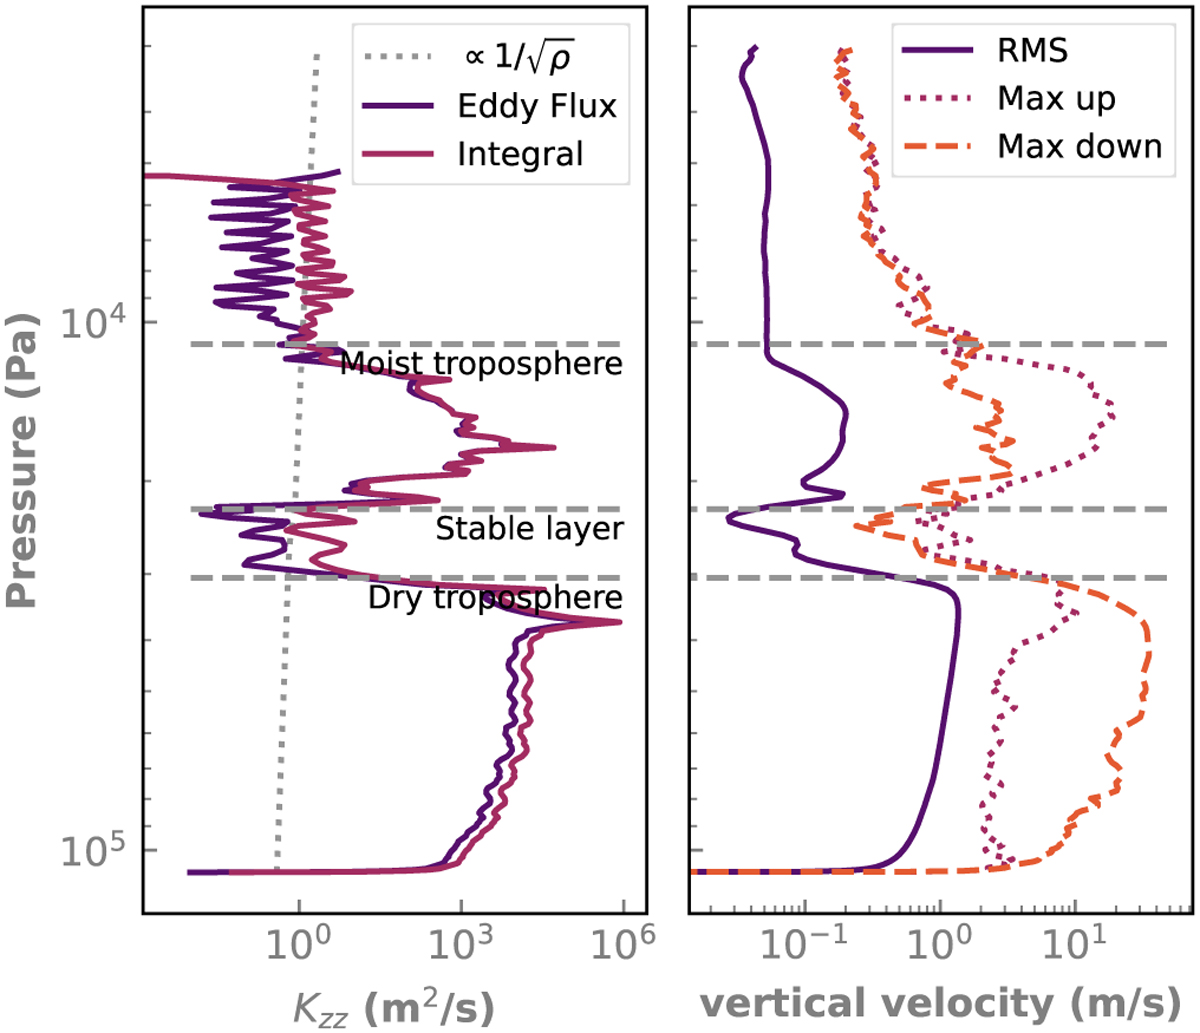
Average vertical profiles of simulated eddy diffusion coefficients and velocities. Left: vertical profile of the equivalent vertical mixing coefficient derived from the simulation using both the eddy flux (Eq. (18)) and integral (Eq. (20)) methods. The dotted line shows the ![]() trend for comparison. The horizontal lines depict the same levels as in Fig. 1. Right: profile of the vertical velocity showing the root-mean-square (solid), maximum upward (dotted), and downward velocity (dashed). Averages and maximum values are computed over temporal and horizontal dimensions.
trend for comparison. The horizontal lines depict the same levels as in Fig. 1. Right: profile of the vertical velocity showing the root-mean-square (solid), maximum upward (dotted), and downward velocity (dashed). Averages and maximum values are computed over temporal and horizontal dimensions.
Current usage metrics show cumulative count of Article Views (full-text article views including HTML views, PDF and ePub downloads, according to the available data) and Abstracts Views on Vision4Press platform.
Data correspond to usage on the plateform after 2015. The current usage metrics is available 48-96 hours after online publication and is updated daily on week days.
Initial download of the metrics may take a while.