Fig. 1
Download original image
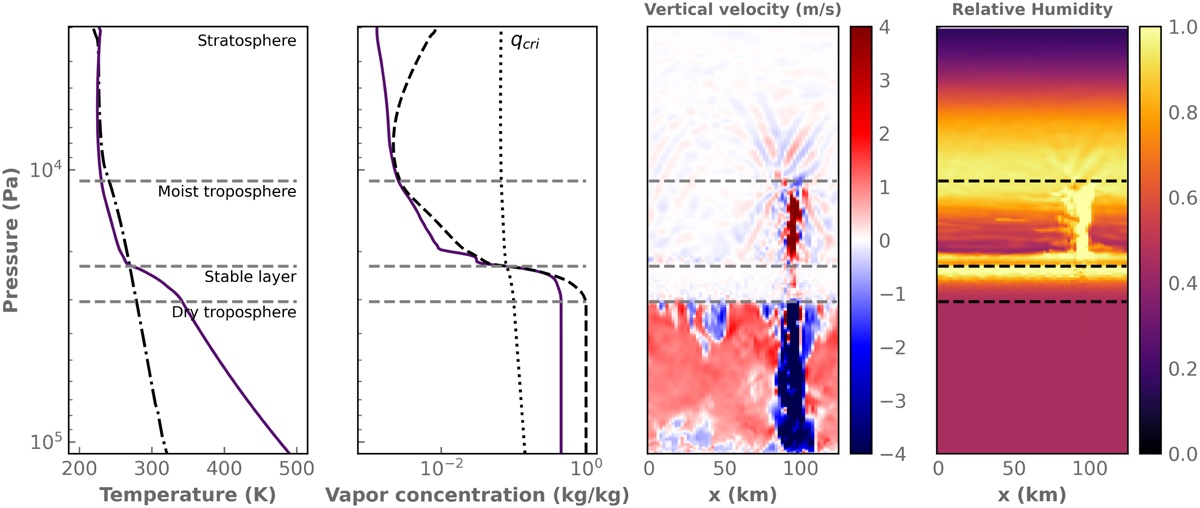
Atmospheric structure of the baseline simulation. From left to right: temperature, water vapor specific concentration, vertical velocity (in m s−1), and relative humidity. The first two panels show horizontal and temporal averages. The dash-dotted black line in the first panel shows the standard moist-adiabat profile for the same conditions. In the second panel, the dotted and dashed black lines show the value of the critical inhibition vapor concentration (Eq. (1)) and the saturation concentration, respectively. The two last panels show snapshots along vertical slices that go through a moist convective plume. From bottom to top, the atmosphere exhibits a dry troposphere, a stable layer where vertical motions are strongly suppressed, a moist troposphere, and a stratosphere. Horizontal dashed lines are plotted at the boundaries between these zones to facilitate the comparison of the altitudes of the various features. The rising moist plume (with maximal velocities of around 8 m s−1) is mirrored by a descending cold plume in the dry region (-15 m s−1) caused by the re-evaporation of rains at the bottom of the stable layer.
Current usage metrics show cumulative count of Article Views (full-text article views including HTML views, PDF and ePub downloads, according to the available data) and Abstracts Views on Vision4Press platform.
Data correspond to usage on the plateform after 2015. The current usage metrics is available 48-96 hours after online publication and is updated daily on week days.
Initial download of the metrics may take a while.