Fig. 6
Download original image
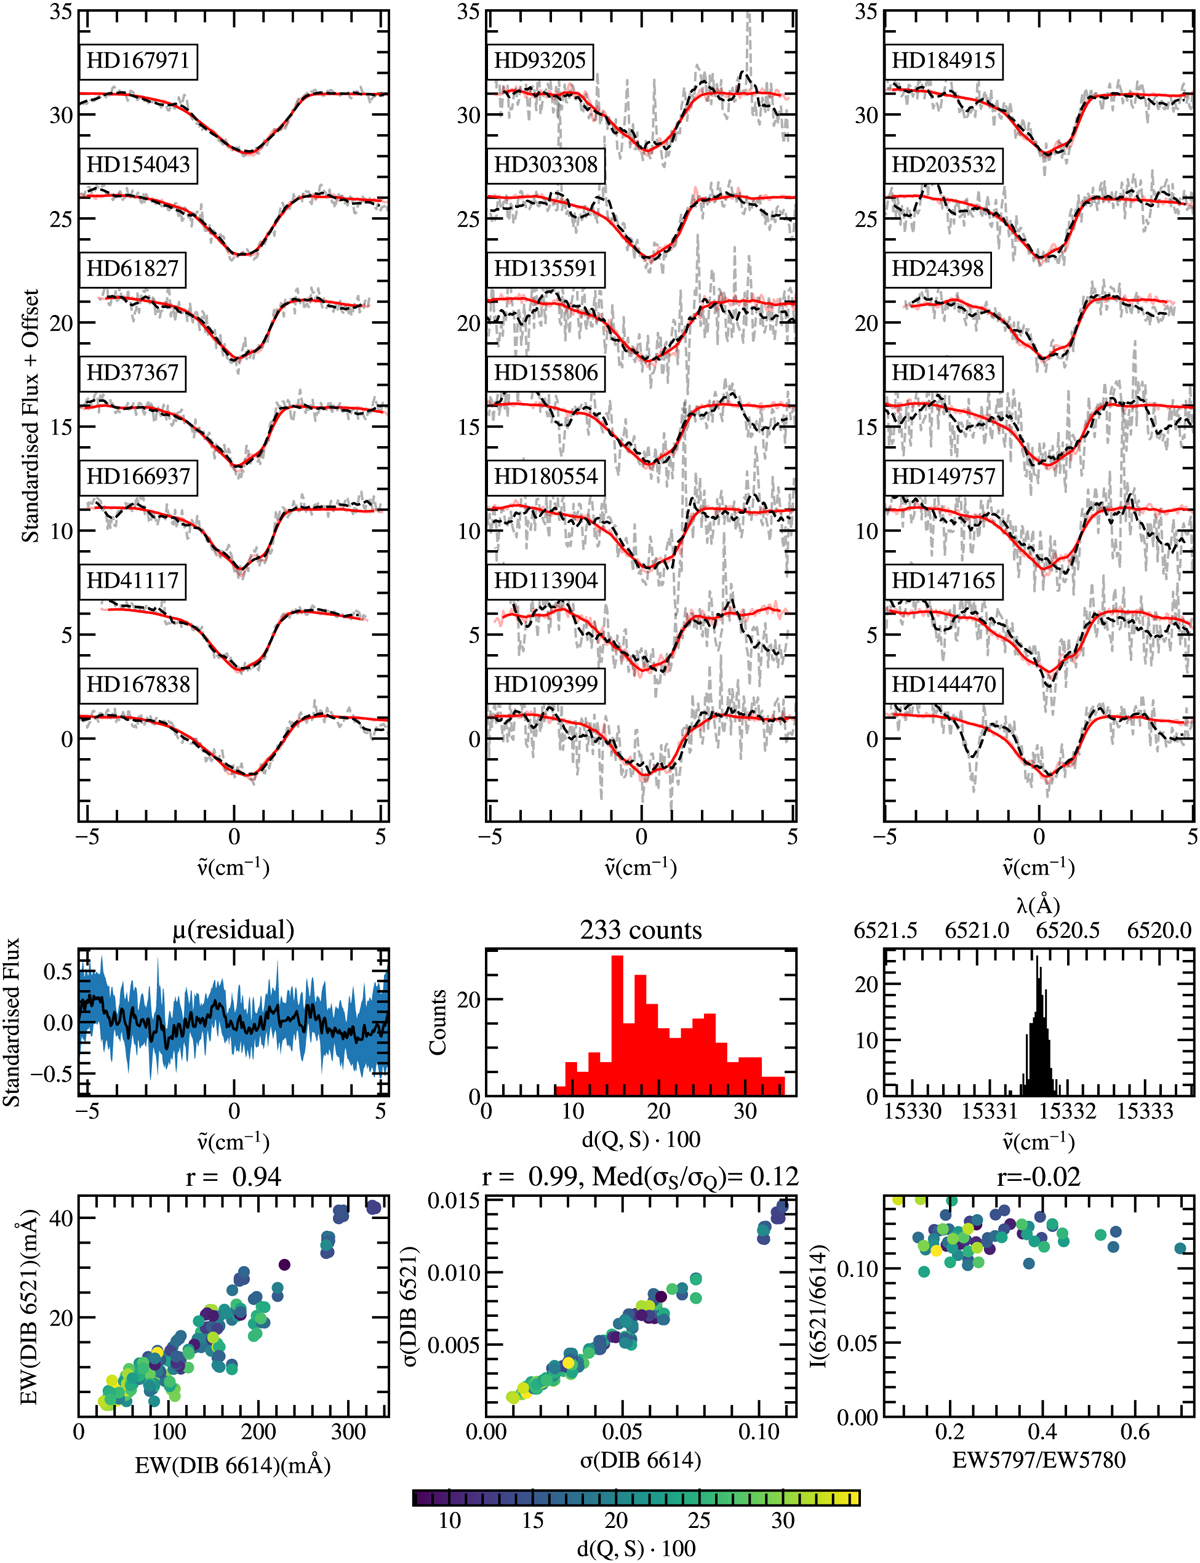
Comparison between the 6614 (solid red line) and 6521 Å (dashed black line) DIBs. The top left column shows the spectra of the seven best-matching sight lines, with the best at the top. The top central panel displays the seven worst-matching sight lines, with the worst at the bottom. The top right panel displays the seven best-matching single cloud sight lines, with the best at the top. Each DIB is shifted to its central wave number. The smoothed spectra used by the algorithm are displayed opaquely, while the un-smoothed spectra are depicted as semi-transparent. In the middle left panel, the mean residuals between the standardised query and subject for the 20 best-matching pairs are visualised. The blue area represents the 1σ confidence interval of the mean residual. In the middle central panel, a histogram of the matched distances of all pairs is shown. In the middle right panel, a histogram of the wave numbers where the matches were found is displayed. In the bottom left panel, the EW correlation of the two investigated DIBs is indicated, with their σ correlation to its right. In the bottom right panel, the intensity ratio, I, is plotted against EW5797/EW5780.
Current usage metrics show cumulative count of Article Views (full-text article views including HTML views, PDF and ePub downloads, according to the available data) and Abstracts Views on Vision4Press platform.
Data correspond to usage on the plateform after 2015. The current usage metrics is available 48-96 hours after online publication and is updated daily on week days.
Initial download of the metrics may take a while.