Fig. 2
Download original image
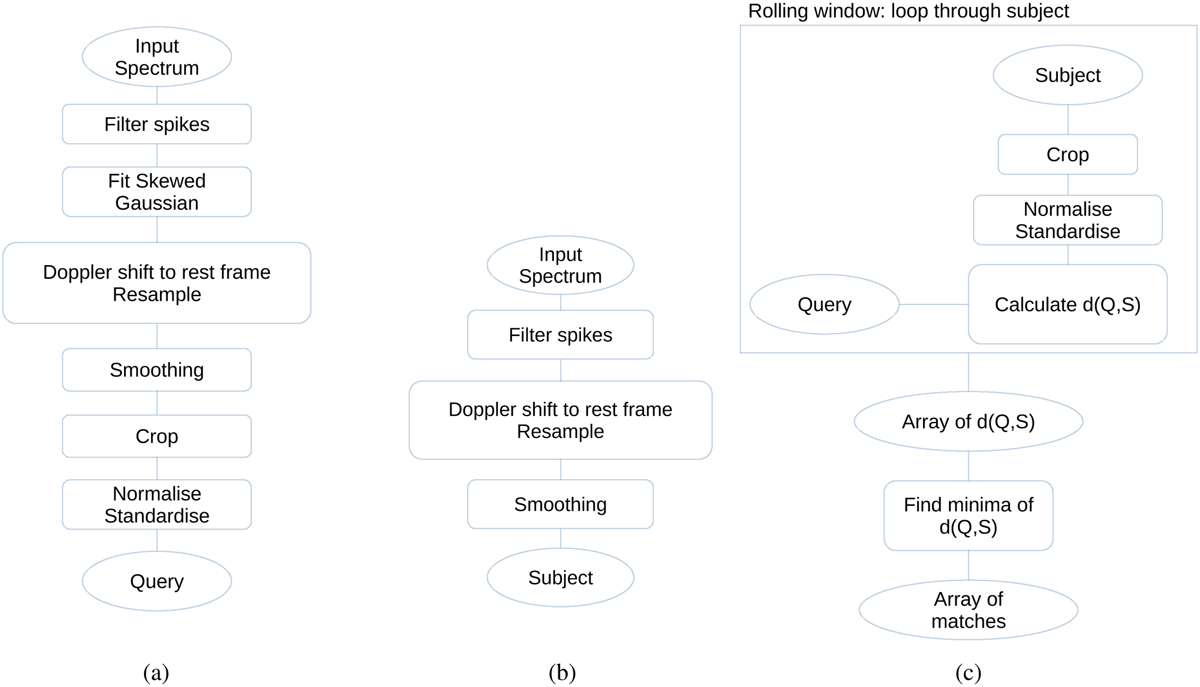
Flow charts of the major processes. Panel 2a: flow chart of the query preparation. Panel 2b: flow chart of the subject preparation. Panel 2c: flow chart of the DIB alignment process. An array of matches was calculated per sight line. For the final analysis, all matches of all sight lines were inspected to find clusters of matches.
Current usage metrics show cumulative count of Article Views (full-text article views including HTML views, PDF and ePub downloads, according to the available data) and Abstracts Views on Vision4Press platform.
Data correspond to usage on the plateform after 2015. The current usage metrics is available 48-96 hours after online publication and is updated daily on week days.
Initial download of the metrics may take a while.