Open Access
Fig. 14
Download original image
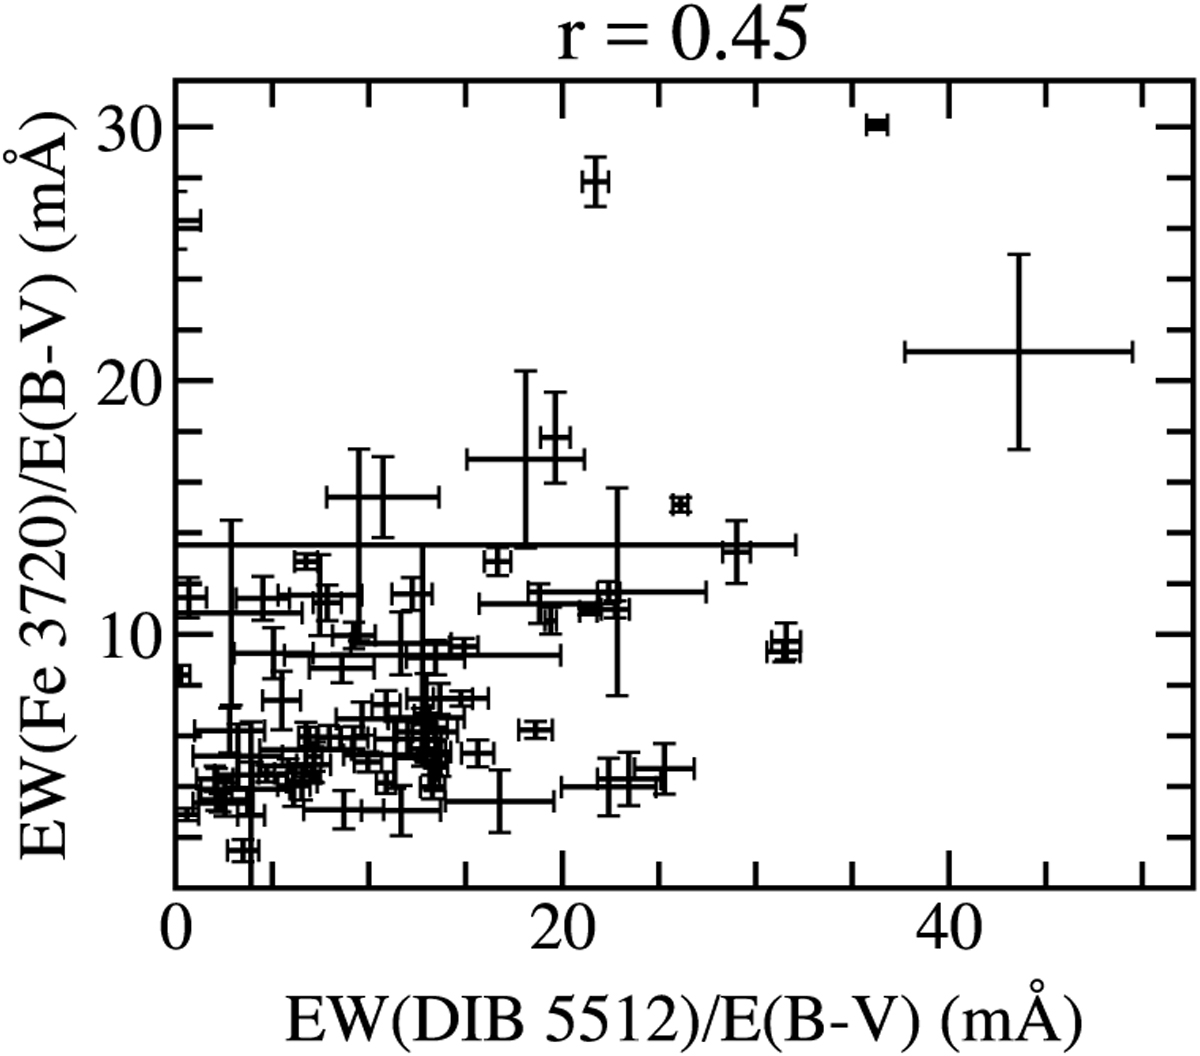
Correlation plot of manual EW measurements of the 5512 Å DIB and the interstellar Fe I line at 3720 Å, normalised by E(B – V). Single outliers like that at the top left (HD 37041) decrease the correlation coefficient significantly, but a linear trend is visible.
Current usage metrics show cumulative count of Article Views (full-text article views including HTML views, PDF and ePub downloads, according to the available data) and Abstracts Views on Vision4Press platform.
Data correspond to usage on the plateform after 2015. The current usage metrics is available 48-96 hours after online publication and is updated daily on week days.
Initial download of the metrics may take a while.