Fig. 3.
Download original image
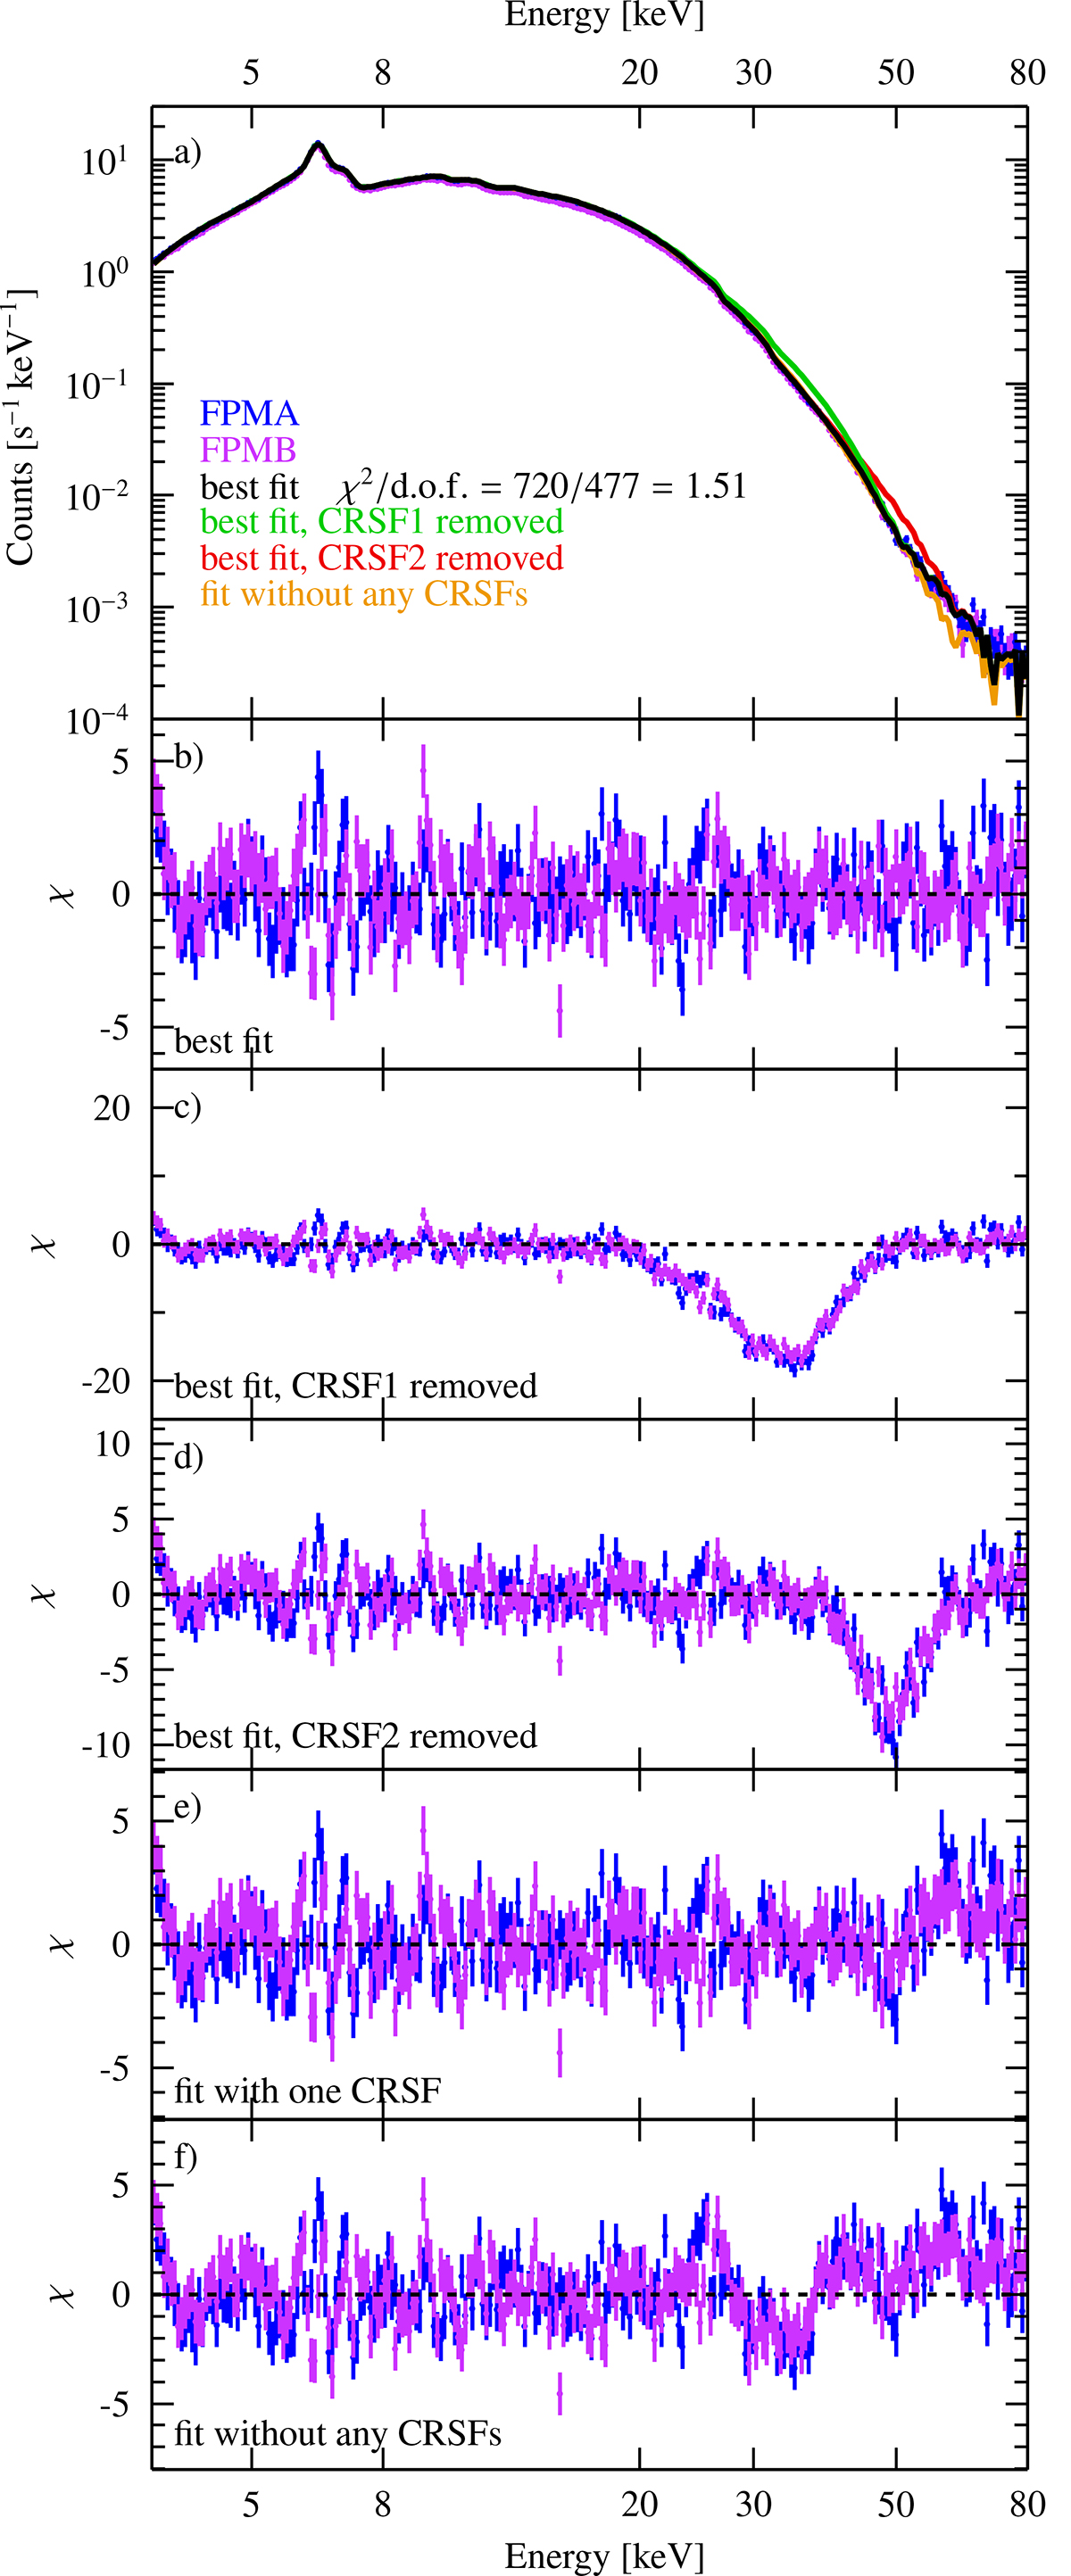
Continuum modeling of GX 301−2. a: spectra of the two NuSTAR FPMs in blue and purple with best fit model shown in black. Models with both CRSFs removed in turn and model without CRSFs are shown in green, red, and orange. b: χ residuals of best fit. c and d: residuals of best fit with both CRSFs removed in succession. e: best fit of alternative model with only one CRSF. f: best fit of alternative model without CRSFs. The spectra have been rebinned for plotting purposes.
Current usage metrics show cumulative count of Article Views (full-text article views including HTML views, PDF and ePub downloads, according to the available data) and Abstracts Views on Vision4Press platform.
Data correspond to usage on the plateform after 2015. The current usage metrics is available 48-96 hours after online publication and is updated daily on week days.
Initial download of the metrics may take a while.