Fig. 2.
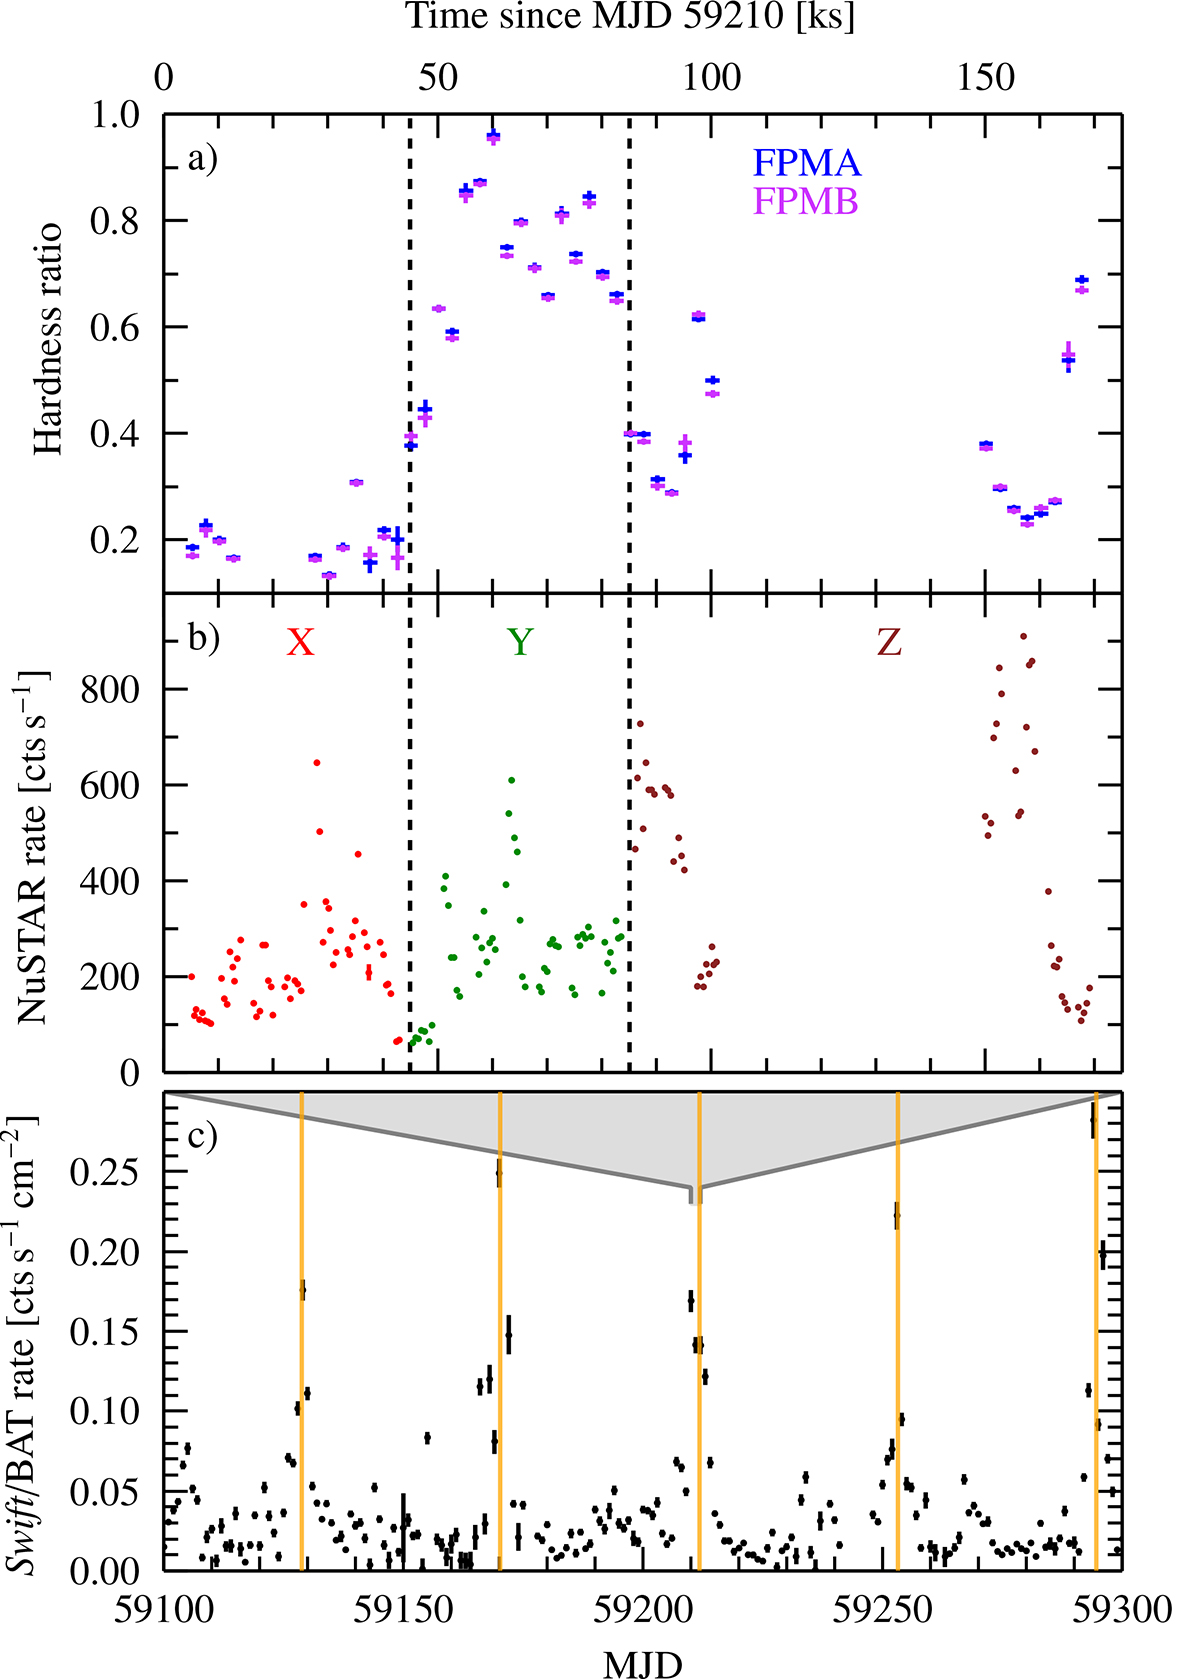
Download original image
NuSTAR observation of GX 301−2 in the context of its long-term behavior. a: hardness ratio, (H − S)/(H + S), of NuSTAR observation with hard energy range 10–30 keV and soft energy range 4–10 keV. The dashed lines indicate the division into time segments studied individually in Sect. 3.2. b: light curve of NuSTAR observation. c: Swift light curve between MJD 59100 and MJD 59300 (Krimm et al. 2013). We show ∼5 orbital periods and indicate the pre-periastron flares with orange bars.
Current usage metrics show cumulative count of Article Views (full-text article views including HTML views, PDF and ePub downloads, according to the available data) and Abstracts Views on Vision4Press platform.
Data correspond to usage on the plateform after 2015. The current usage metrics is available 48-96 hours after online publication and is updated daily on week days.
Initial download of the metrics may take a while.