Fig. 9
Download original image
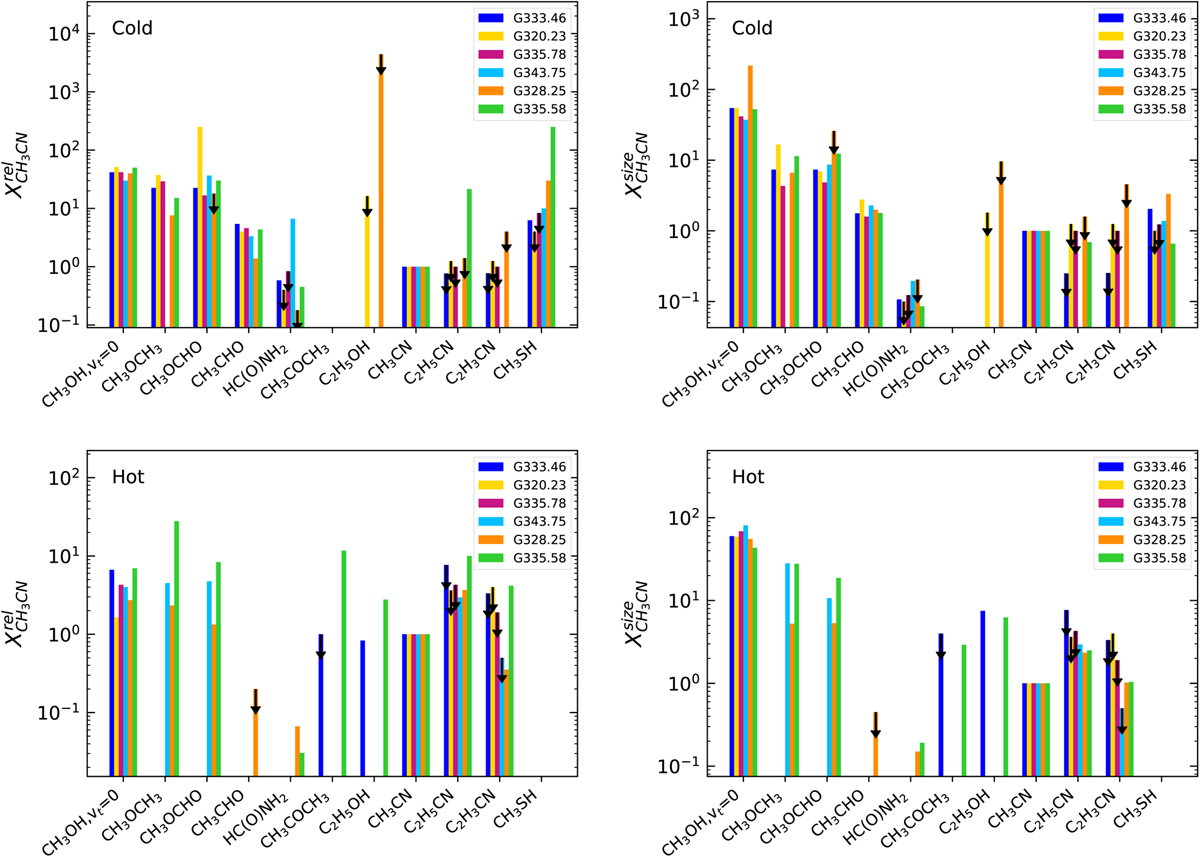
Abundances of COMs relative to CH3CN in the cold and warm components of the envelope. The first row represents the cold component of the envelope with the relative abundances to CH3CN without size correction (top left panel) and including the correction by the size of the emitting region (top right panel). The bottom row represents the hot component of the envelope with the relative abundances to CH3CN without size correction (bottom left panel) and with size correction (bottom right panel). Each source is indicated in a different colour. Black arrows indicate upper limits.
Current usage metrics show cumulative count of Article Views (full-text article views including HTML views, PDF and ePub downloads, according to the available data) and Abstracts Views on Vision4Press platform.
Data correspond to usage on the plateform after 2015. The current usage metrics is available 48-96 hours after online publication and is updated daily on week days.
Initial download of the metrics may take a while.