Open Access
Fig. 6
Download original image
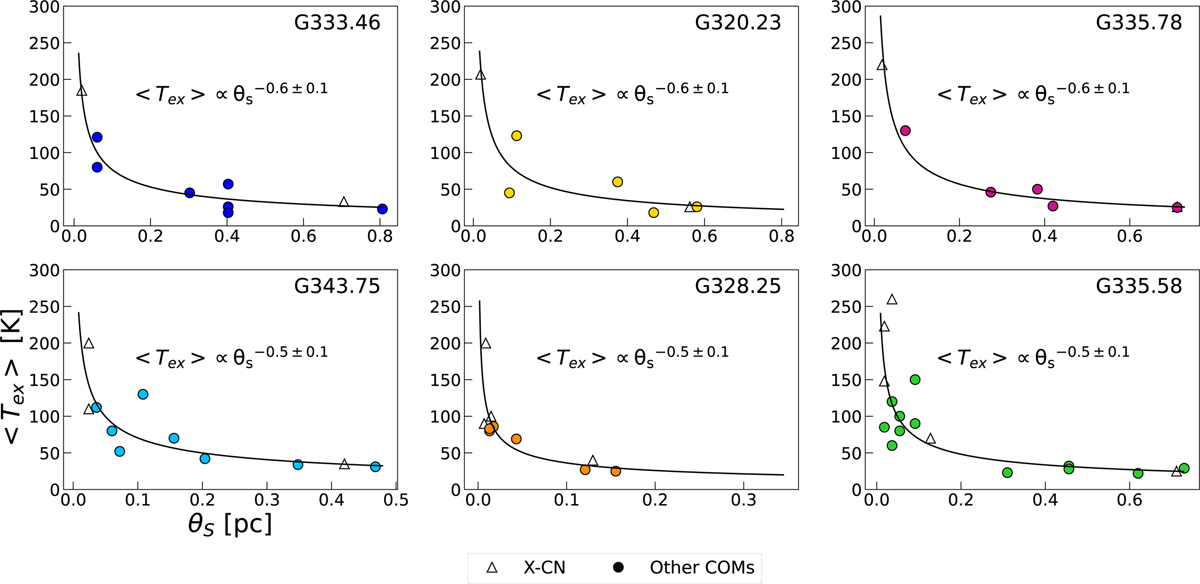
Excitation temperature of COMs from the cold and warm gas vs their size of emission region. The black curve represents the power-law fit of the data. The triangles represent the cyanides and the circles represent the other COMs. We show here the results of both the warm and cold gas phases.
Current usage metrics show cumulative count of Article Views (full-text article views including HTML views, PDF and ePub downloads, according to the available data) and Abstracts Views on Vision4Press platform.
Data correspond to usage on the plateform after 2015. The current usage metrics is available 48-96 hours after online publication and is updated daily on week days.
Initial download of the metrics may take a while.