Fig. 5
Download original image
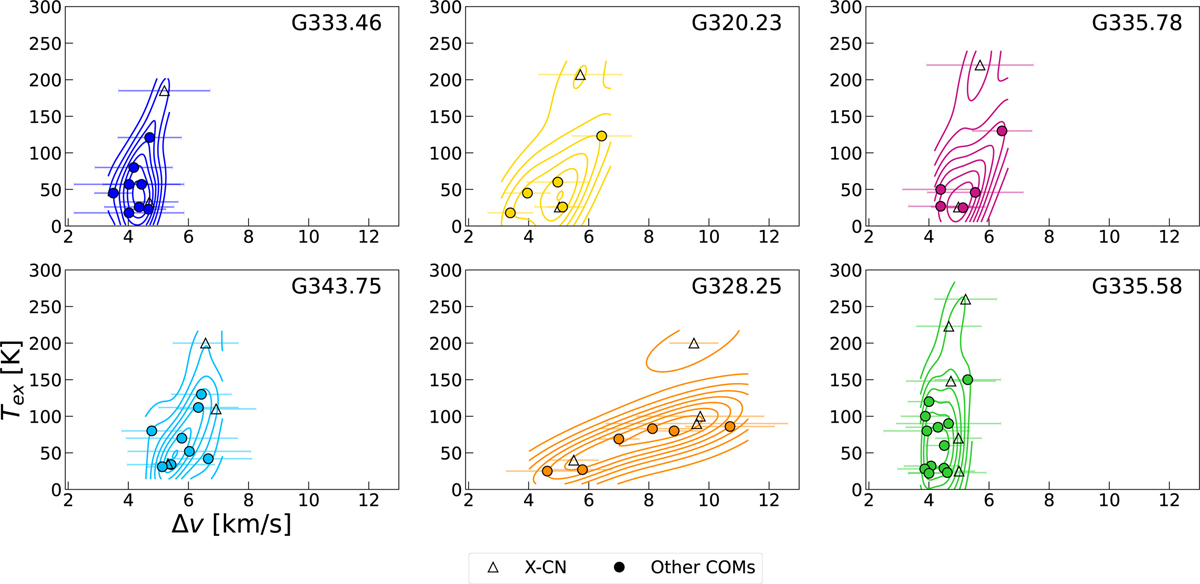
Excitation temperature (Tex) versus mean line width (Δv) of each COM in the cold and warm components. Each data point represents the line width of a given molecule averaged over all its transitions. The contours show the Gaussian Kernel distribution of the datapoints. Transitions fitted with multiple velocity components are considered as individual measurements in this figure. The errorbars represent the dispersion between the line width measurements for all the transitions. The triangles represent the complex cyanides and the circles represent the other COMs.
Current usage metrics show cumulative count of Article Views (full-text article views including HTML views, PDF and ePub downloads, according to the available data) and Abstracts Views on Vision4Press platform.
Data correspond to usage on the plateform after 2015. The current usage metrics is available 48-96 hours after online publication and is updated daily on week days.
Initial download of the metrics may take a while.