Fig. 4
Download original image
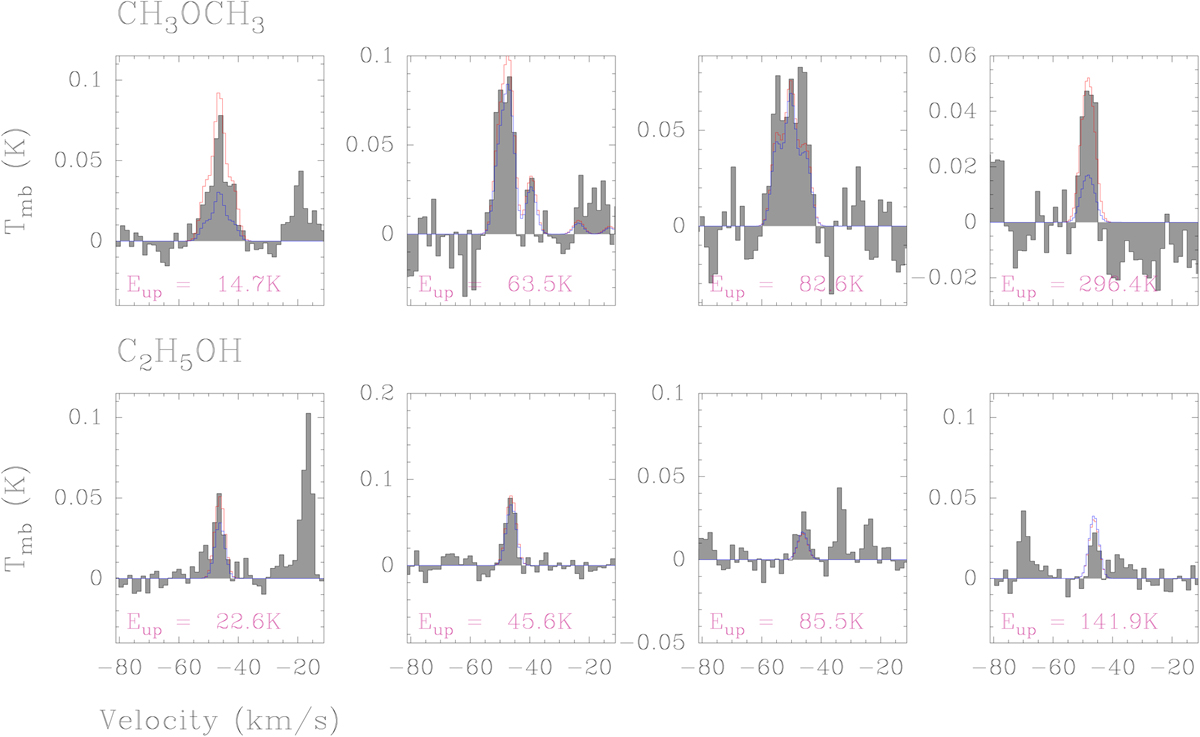
CH3OCH3 (top panel) and C2H5OH (bottom panel) lines (black spectrum) towards G335.58. The blue and red spectra represent the one and two temperature component models, respectively. We indicate the upper level energies in the bottom of each panel. C2H5OH is well fitted with only one temperature component while CH3OCH3 requires a second, higher temperature component in order to fit all lines simultaneously.
Current usage metrics show cumulative count of Article Views (full-text article views including HTML views, PDF and ePub downloads, according to the available data) and Abstracts Views on Vision4Press platform.
Data correspond to usage on the plateform after 2015. The current usage metrics is available 48-96 hours after online publication and is updated daily on week days.
Initial download of the metrics may take a while.