Fig. 18
Download original image
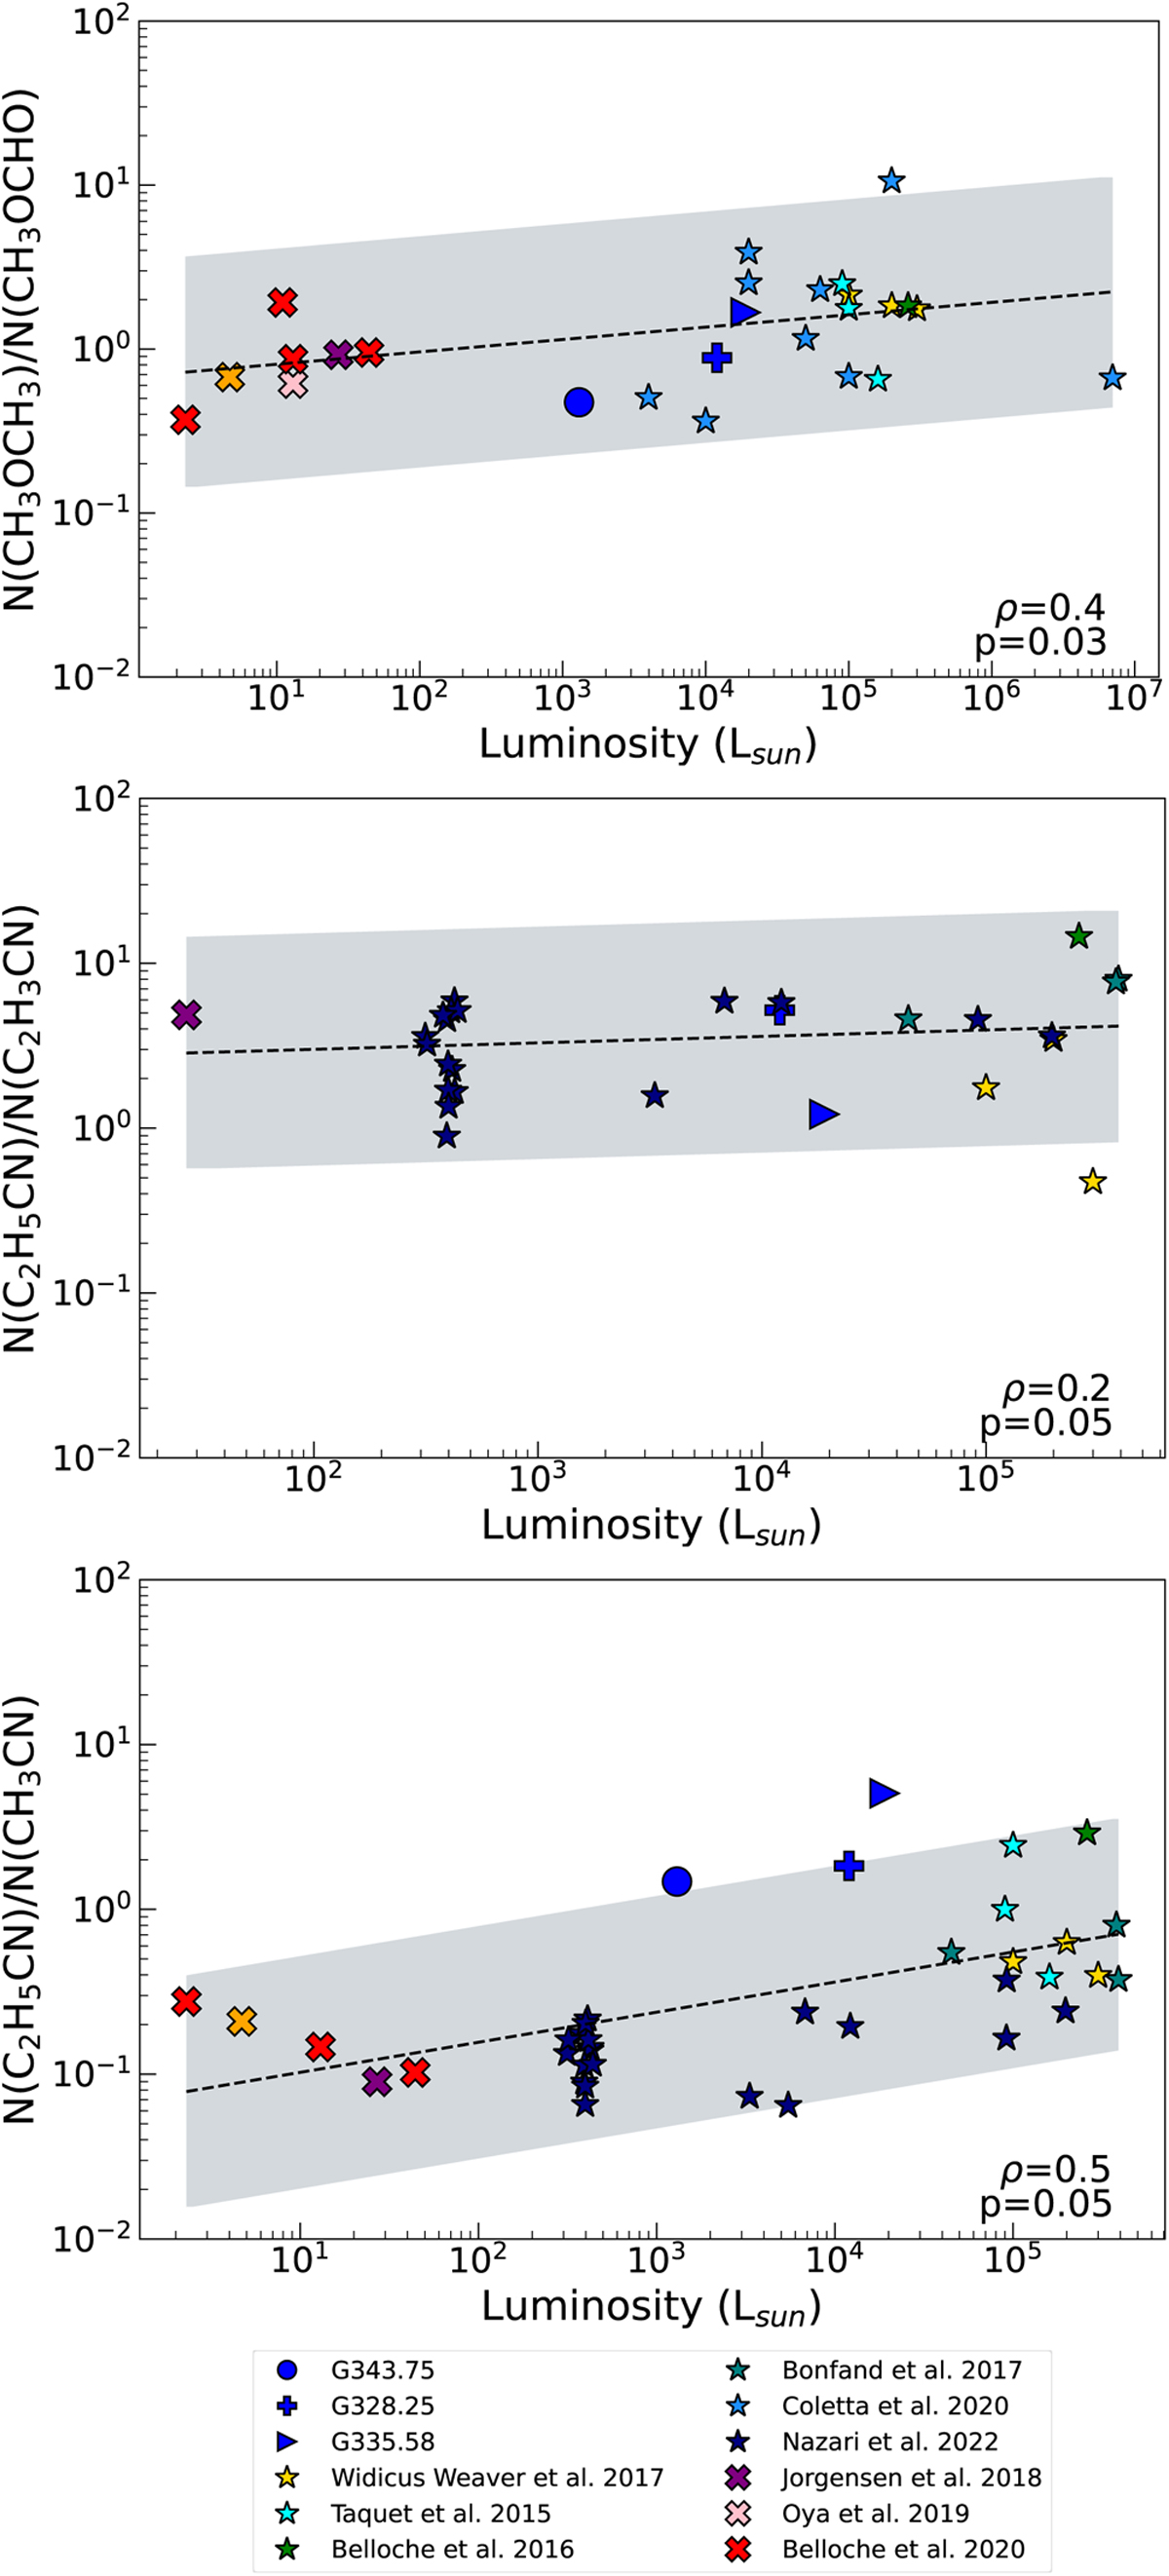
Top panel: abundances of CH3OCH3 relative to CH3OCHO versus the bolometric luminosity. Middle panel: abundances of C2H5CN relative to C2H3CN versus the bolometric luminosity. Bottom panel: abundances of C2H5CN relative to CH3CN versus the luminosity. The dashed black line represents the fit to the data and the grey shaded area represents a factor 5 scatter from the fit. Our data points are represented in blue, the high-mass protostars (Belloche et al. 2016; Widicus Weaver et al. 2017; Coletta et al. 2020; Nazari et al. 2022) are represented with a star. The low-mass protostars are presented with crosses (Oya et al. 2017; Jørgensen et al. 2018; Belloche et al. 2020).
Current usage metrics show cumulative count of Article Views (full-text article views including HTML views, PDF and ePub downloads, according to the available data) and Abstracts Views on Vision4Press platform.
Data correspond to usage on the plateform after 2015. The current usage metrics is available 48-96 hours after online publication and is updated daily on week days.
Initial download of the metrics may take a while.