Fig. 13
Download original image
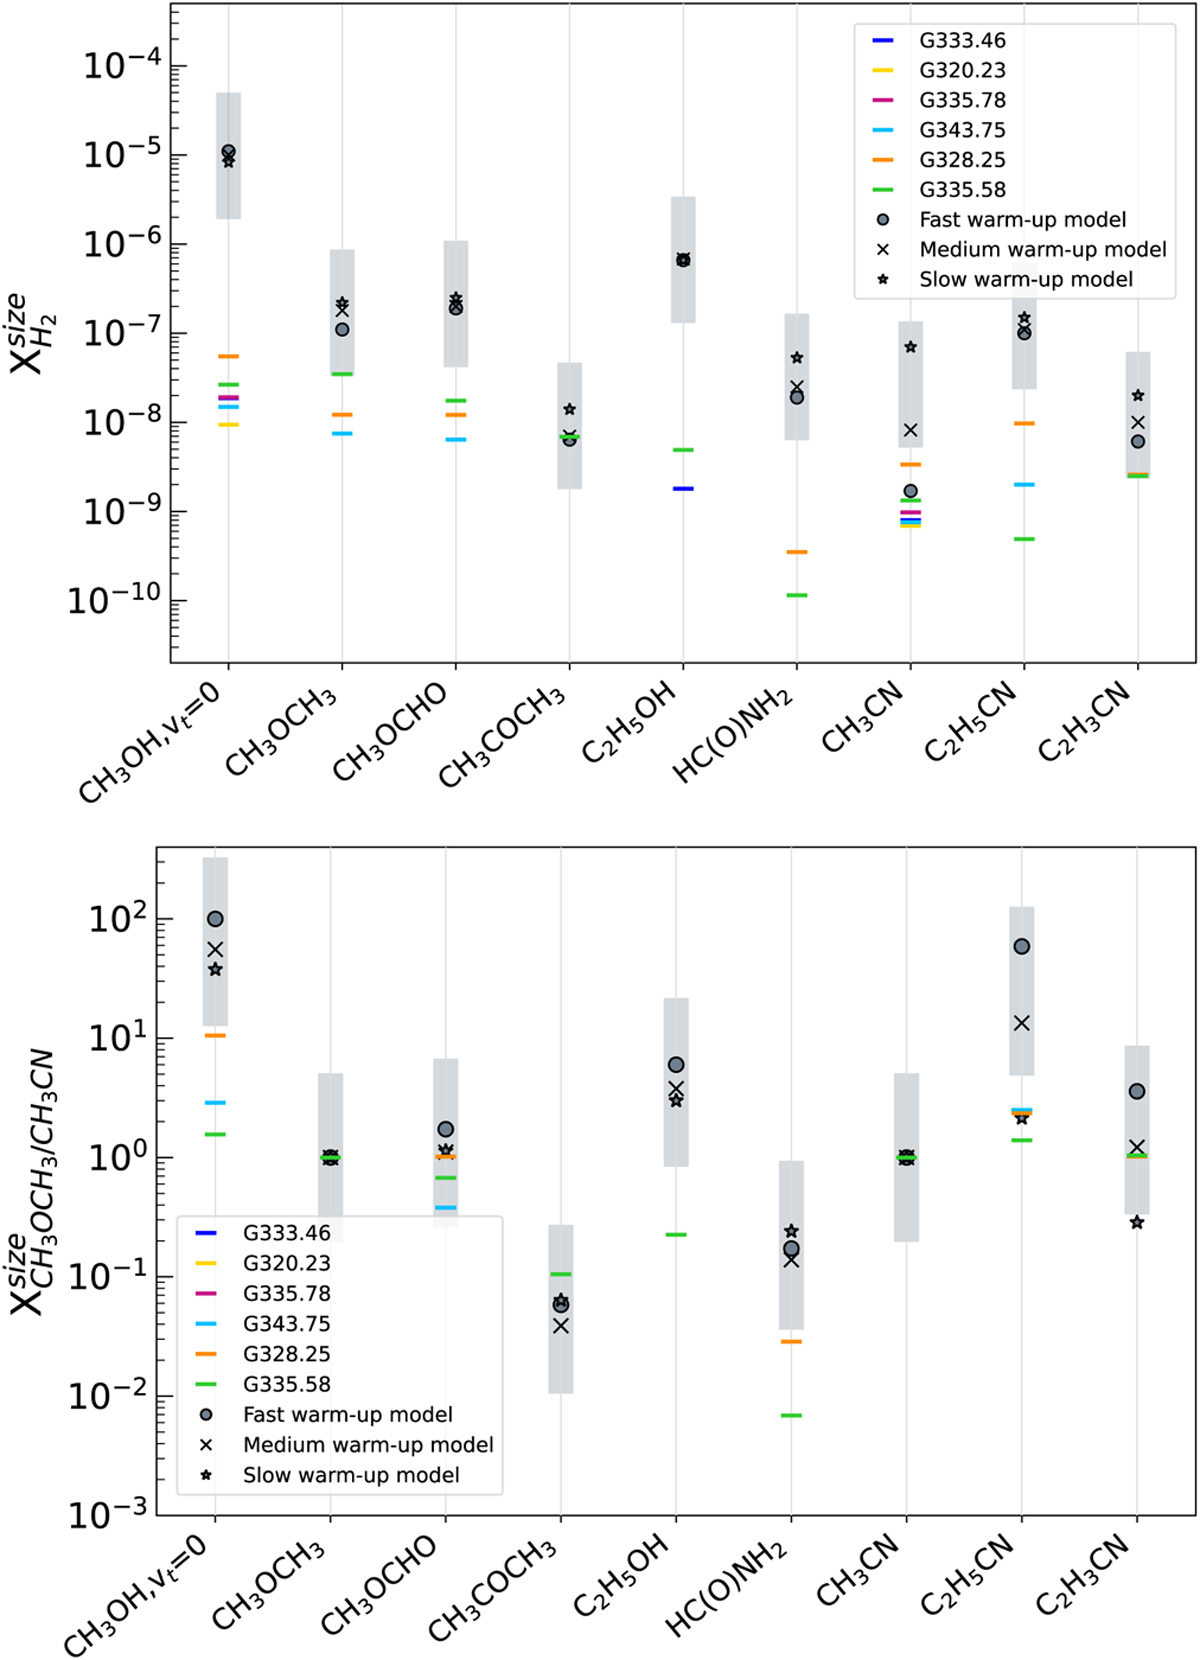
Upper panel: comparison between the abundances relative to H2 in our objects and the peak surface abundances in the models from Garrod et al. 2022 (Table 17). Lower panel: comparison between the abundances relative to CH3OCH3 for O-bearing molecules and CH3SH and relative to CH3CN for cyanides. Each source is represented by a different colour. The models are represented by three symbols. The grey area represents a factor 5 scatter from the average model values.
Current usage metrics show cumulative count of Article Views (full-text article views including HTML views, PDF and ePub downloads, according to the available data) and Abstracts Views on Vision4Press platform.
Data correspond to usage on the plateform after 2015. The current usage metrics is available 48-96 hours after online publication and is updated daily on week days.
Initial download of the metrics may take a while.