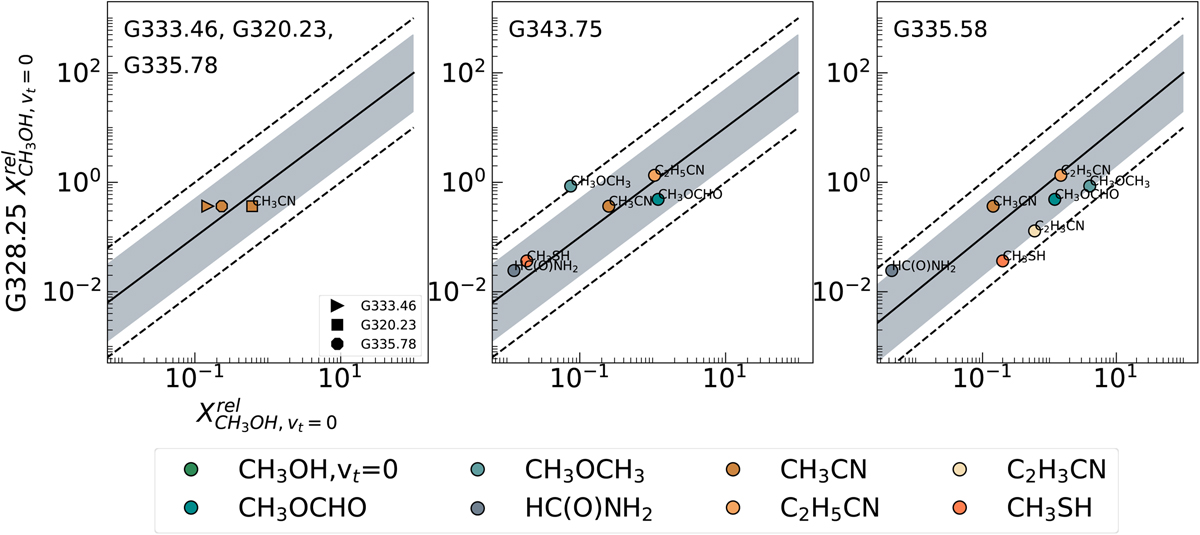
Fig. 12
Download original image
Comparison of molecular abundances relative to methanol (CH3OH, vt=0) in the warm gas phase of our sample where G328.25 was chosen as a reference. The left panel shows G333.46, G320.23, and G335.78, the middle panel G343.75, and the right panel G335.58. The black solid line represents the one-to-one relation. The grey shaded region corresponds to a factor 5 scatter from the one-to-one relation. The dashed lines represent a factor 10 scatter from the one-to-one relation. Each molecule is displayed in a different colour.
Current usage metrics show cumulative count of Article Views (full-text article views including HTML views, PDF and ePub downloads, according to the available data) and Abstracts Views on Vision4Press platform.
Data correspond to usage on the plateform after 2015. The current usage metrics is available 48-96 hours after online publication and is updated daily on week days.
Initial download of the metrics may take a while.