Fig. 11
Download original image
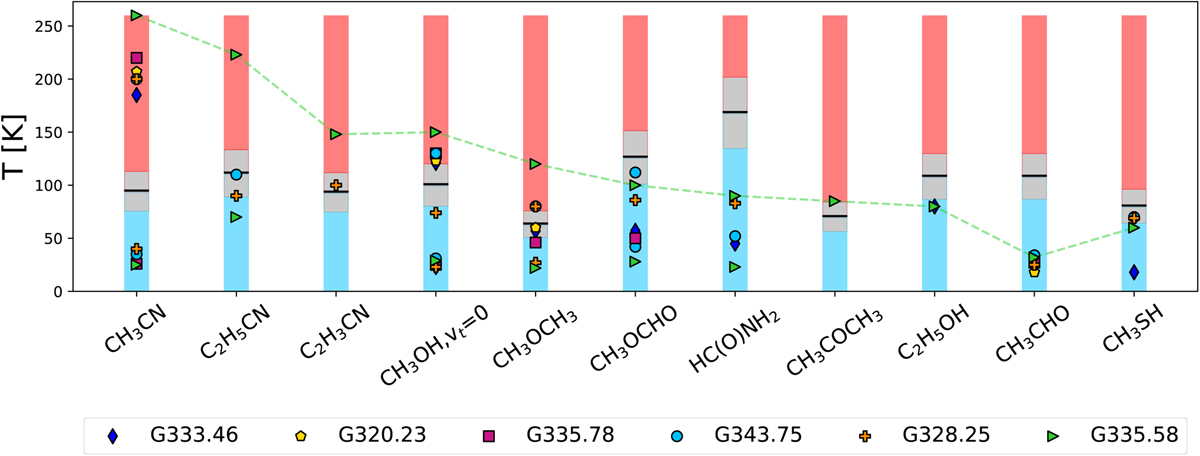
Excitation temperatures of the COMs. Each source is represented by a different colour and symbol. The black line shows the desorption temperature for each molecule (references are given in Table 7). The blue and red histograms represent the temperatures below and above the desorption temperature, respectively. The grey area shows a 20% error on the desorption temperature. The green line represents the variation of temperature between different molecules towards G335.58.
Current usage metrics show cumulative count of Article Views (full-text article views including HTML views, PDF and ePub downloads, according to the available data) and Abstracts Views on Vision4Press platform.
Data correspond to usage on the plateform after 2015. The current usage metrics is available 48-96 hours after online publication and is updated daily on week days.
Initial download of the metrics may take a while.