Fig. 6.
Download original image
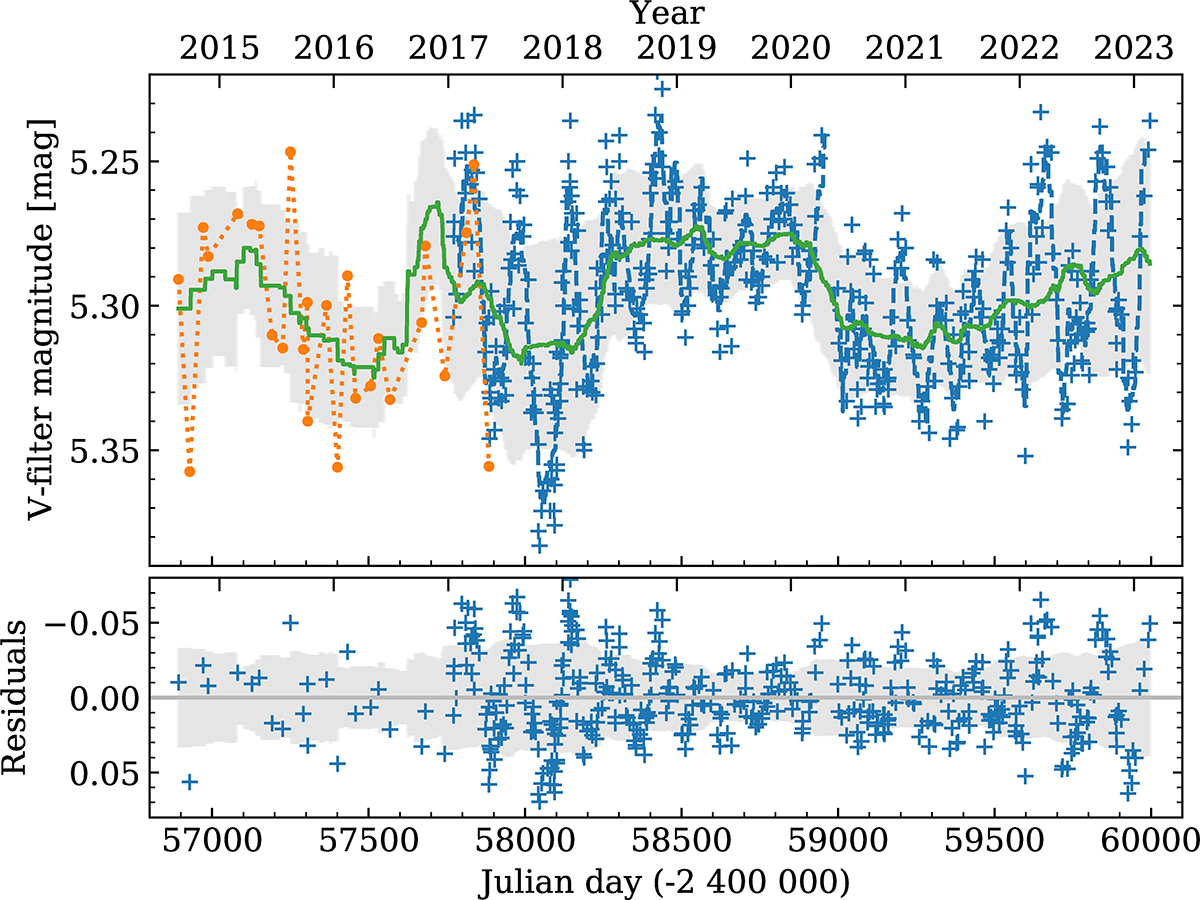
V-filter brightness from AAVSO Vollmann’s data and Gaia data. The solid green line shows a running mean of 300 days, and the light grey shading corresponds to the standard deviation of the running mean. In the lower figure we show the residuals of the mean level that illustrate the amplitudes of short-term fluctuations, which vary between 0.05–0.13 mag.
Current usage metrics show cumulative count of Article Views (full-text article views including HTML views, PDF and ePub downloads, according to the available data) and Abstracts Views on Vision4Press platform.
Data correspond to usage on the plateform after 2015. The current usage metrics is available 48-96 hours after online publication and is updated daily on week days.
Initial download of the metrics may take a while.