Fig. 17.
Download original image
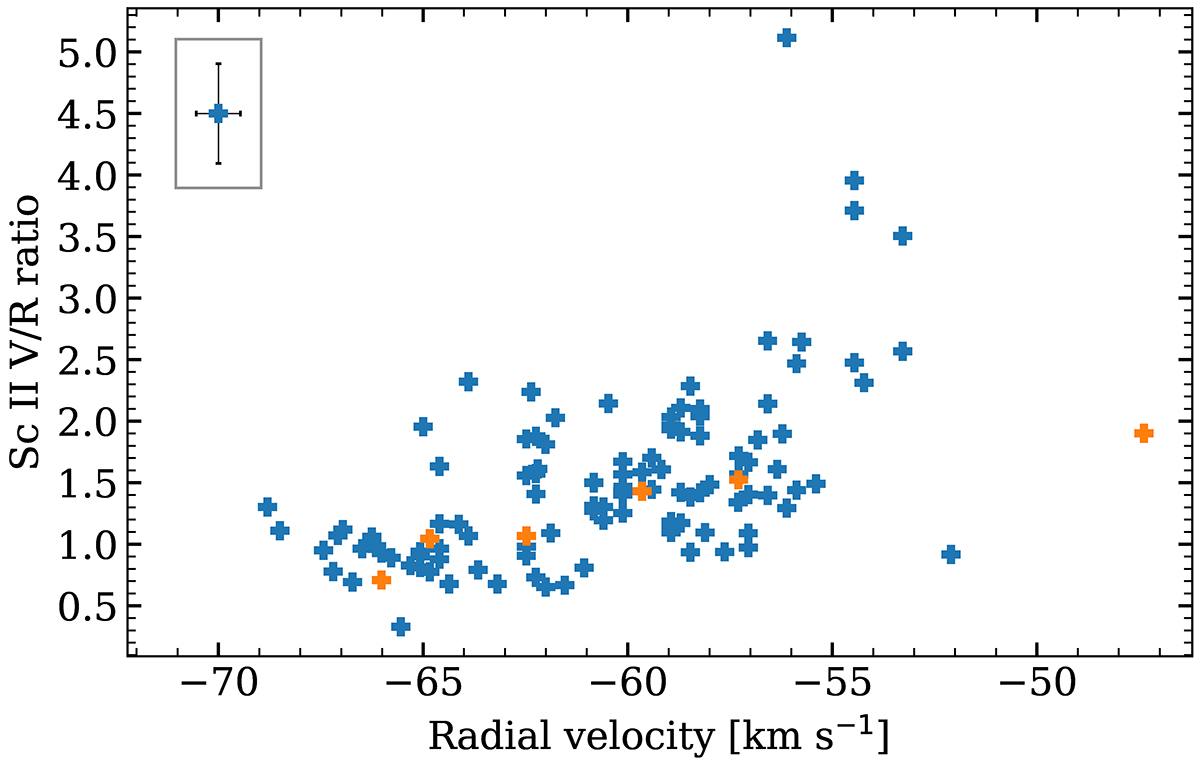
Radial velocity based on the Si II lines and the Sc II violet and red emission component intensity ratio. The epochs displayed on Fig. 16 have been highlighted with a lighter orange colour. The sample error in the box shows the size of average error bars, the error size in the y-direction increases proportionally with the calculated ratio.
Current usage metrics show cumulative count of Article Views (full-text article views including HTML views, PDF and ePub downloads, according to the available data) and Abstracts Views on Vision4Press platform.
Data correspond to usage on the plateform after 2015. The current usage metrics is available 48-96 hours after online publication and is updated daily on week days.
Initial download of the metrics may take a while.