Fig. 16.
Download original image
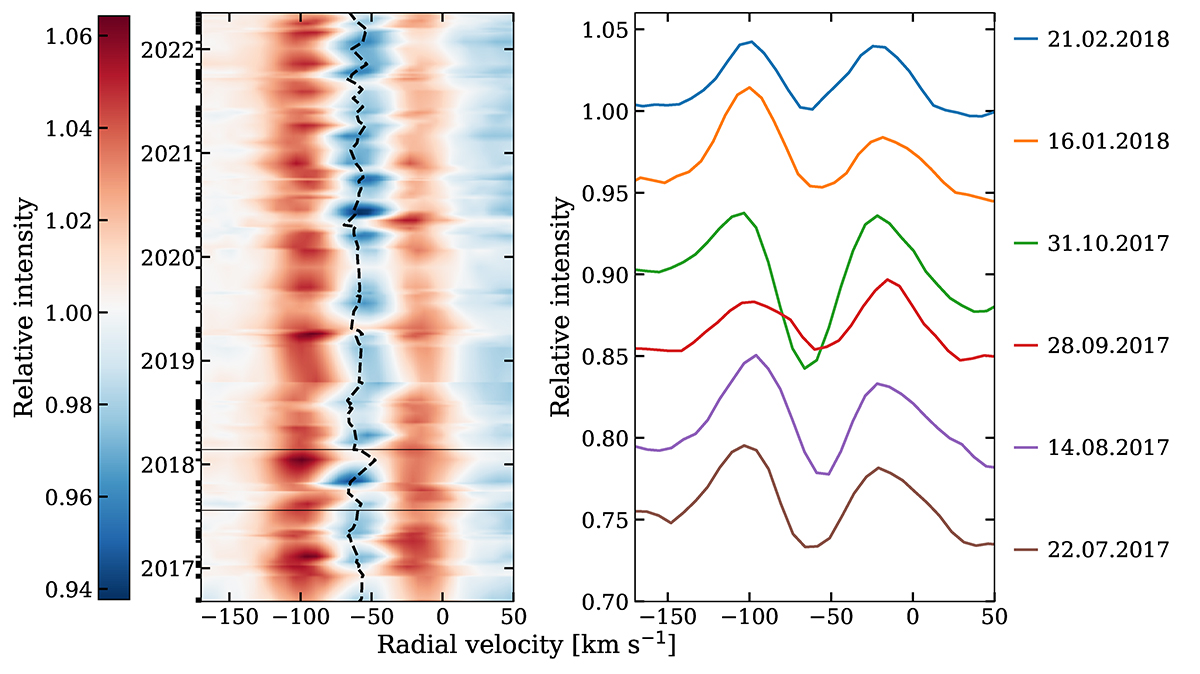
Variability of Sc IIλ6604 line over 6 years. Left: a dynamic spectrum of all TO spectra. White colour corresponds to the continuum level, blue colour indicates absorption and red colour is emission. Darker colour corresponds to stronger absorption or emission strength. Epochs of observations are marked with notches on the left, and gaps between observations have been filled using linear interpolation. The dashed black line shows radial velocity measured from Si II lines. The box indicates the period of observations seen on the right. Right: 6 individual observations in 2017 and 2018. The spectra have been shifted vertically by 0.05 mag between each epoch for clarity. The radial velocity scale on all plots is the same.
Current usage metrics show cumulative count of Article Views (full-text article views including HTML views, PDF and ePub downloads, according to the available data) and Abstracts Views on Vision4Press platform.
Data correspond to usage on the plateform after 2015. The current usage metrics is available 48-96 hours after online publication and is updated daily on week days.
Initial download of the metrics may take a while.