Open Access
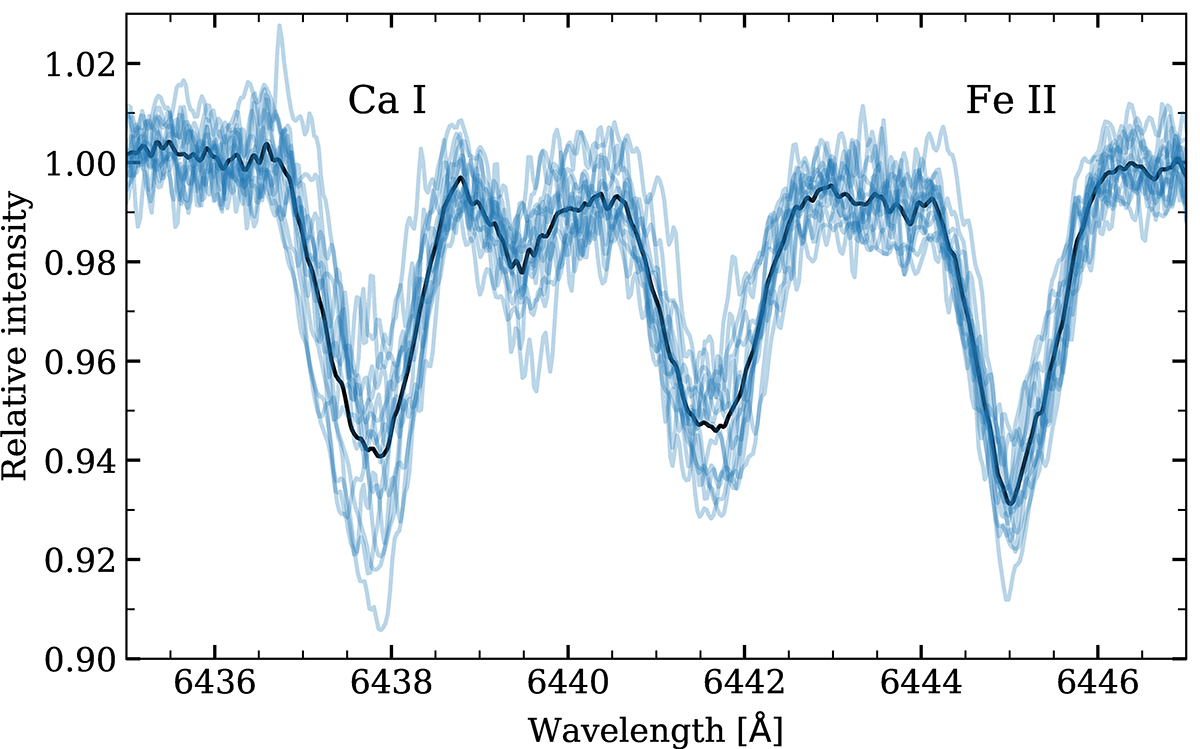
Fig. 13.
Download original image
Variability in the shape of profiles of Ca I and Fe II lines that we used for temperature determination. FIES high- and medium-resolution spectra taken at the NOT in 2021 and 2022. The spectra have been superimposed and the dark line traces the shape of the average profile.
Current usage metrics show cumulative count of Article Views (full-text article views including HTML views, PDF and ePub downloads, according to the available data) and Abstracts Views on Vision4Press platform.
Data correspond to usage on the plateform after 2015. The current usage metrics is available 48-96 hours after online publication and is updated daily on week days.
Initial download of the metrics may take a while.