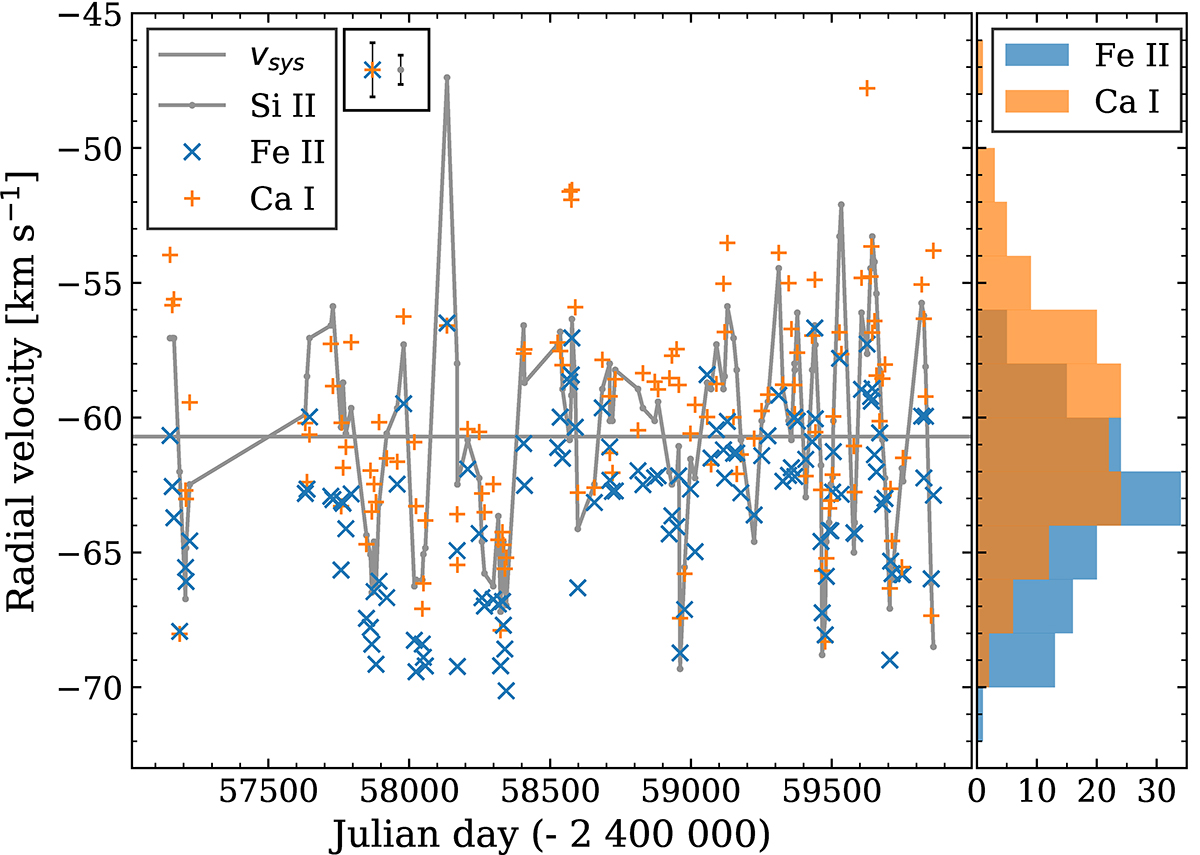
Fig. 12.
Download original image
Centroid radial velocities of Si II, Ca I, and Fe II lines (from Si IIvsys = −60.7 km s−1) and their distribution histograms. The error bars for Ca I and Fe II (shown in the corner) are larger than the errors for radial velocities from the Si II line, because the Fe II and Ca I lines are much shallower and therefore the results are more affected by noise. Snapshots of both line profiles can be seen in Fig. 13.
Current usage metrics show cumulative count of Article Views (full-text article views including HTML views, PDF and ePub downloads, according to the available data) and Abstracts Views on Vision4Press platform.
Data correspond to usage on the plateform after 2015. The current usage metrics is available 48-96 hours after online publication and is updated daily on week days.
Initial download of the metrics may take a while.