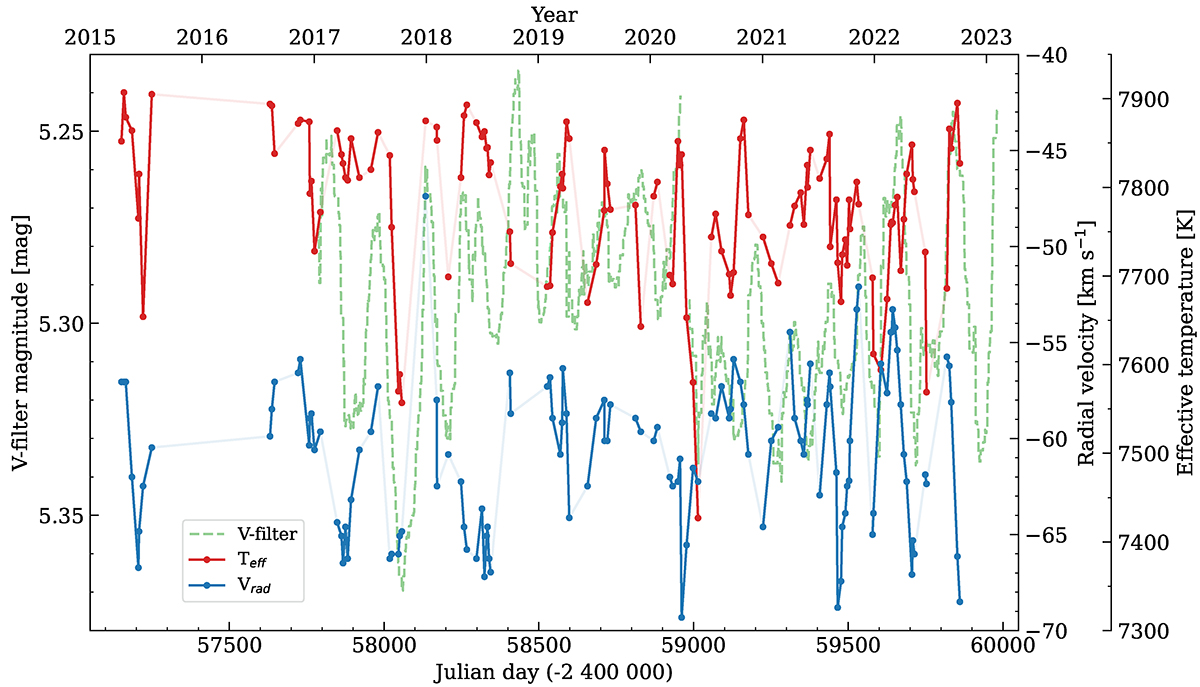
Fig. 11.

Download original image
Combined timeline of our measurements: V-filter magnitudes (dashed green line, smoothed Vollmann 2023 data from AAVSO), radial velocity measurements (blue), and effective temperatures (red). For the Teff and vrad data, a solid line connects points that have been taken in less than 30-day intervals to further emphasise (dis-)similarities in variability behaviour between different physical parameters. The radial velocity and effective temperature data are included in Table C.1.
Current usage metrics show cumulative count of Article Views (full-text article views including HTML views, PDF and ePub downloads, according to the available data) and Abstracts Views on Vision4Press platform.
Data correspond to usage on the plateform after 2015. The current usage metrics is available 48-96 hours after online publication and is updated daily on week days.
Initial download of the metrics may take a while.


