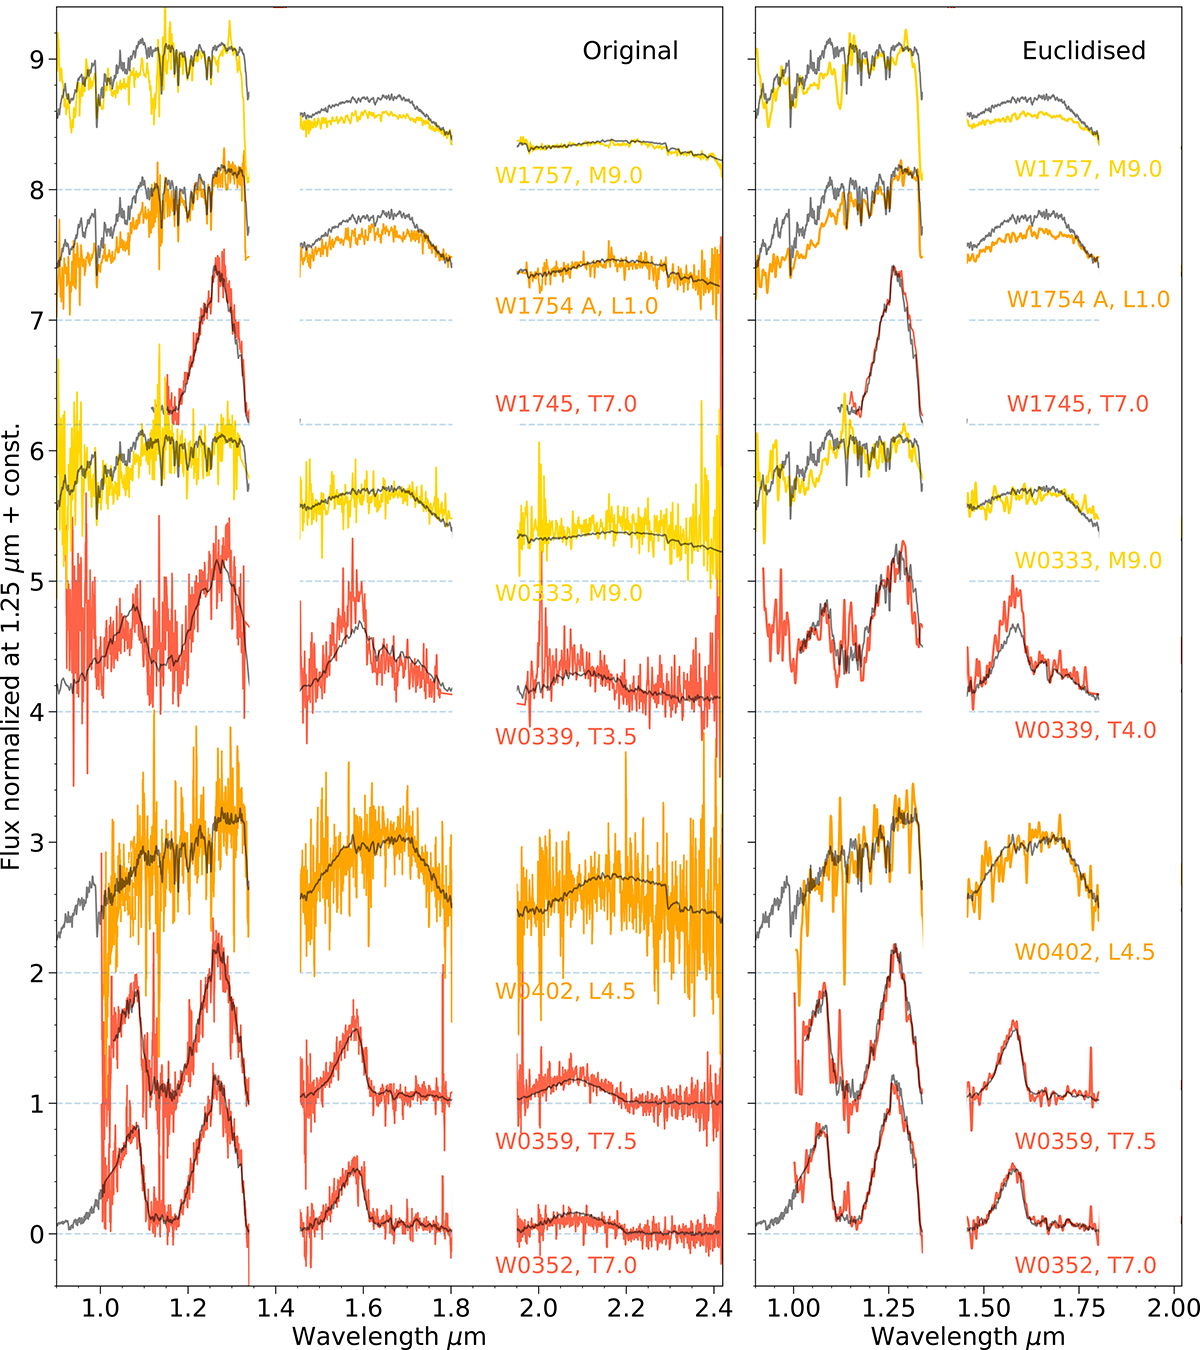
Fig. 4.
Download original image
Normalised UCD spectra in the three EDFs. From the top to the bottom are UCDs from EDFs North, Fornax, and South, respectively. The VLT/X-shooter and GTC/EMIR spectra were smoothed with a 31 and 5-pixel-size window, respectively. All the spectra were classified into spectral subclasses, and the best-fit templates are plotted in grey (left panel). We Euclidised the spectra and the classifications remain consistent within 0.5 subclasses (right panel).
Current usage metrics show cumulative count of Article Views (full-text article views including HTML views, PDF and ePub downloads, according to the available data) and Abstracts Views on Vision4Press platform.
Data correspond to usage on the plateform after 2015. The current usage metrics is available 48-96 hours after online publication and is updated daily on week days.
Initial download of the metrics may take a while.