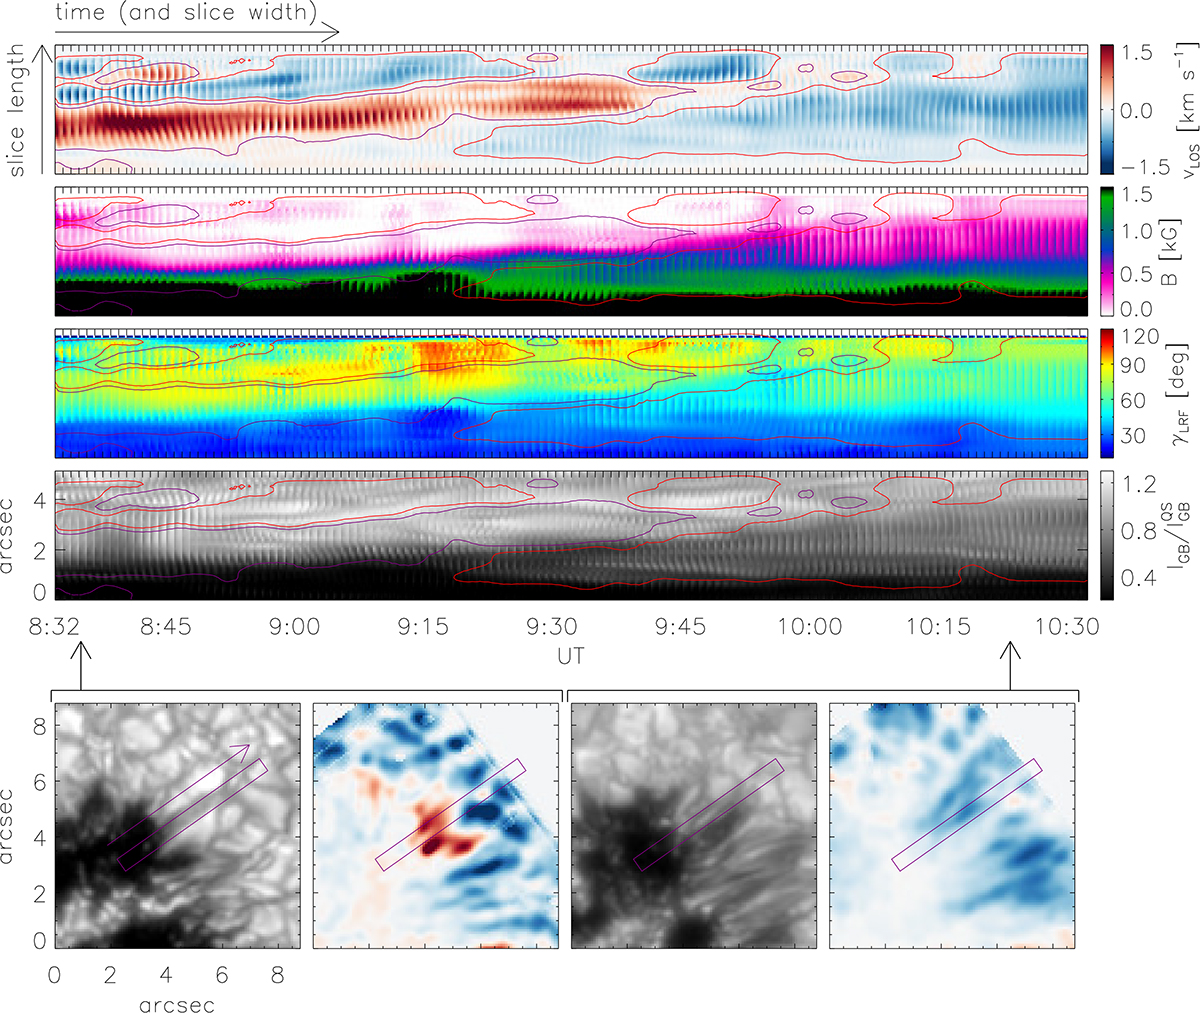
Fig. 3.
Download original image
Bi-directional flow in elongated granules. Top panels: time slices of selected penumbra-formation region on the sunspot centre side. From top to bottom: LOS velocities, magnetic field strength, inclination (LRF), and G-band intensity. Bottom panels: context maps containing the areas (marked by purple boxes) selected for the time slices as seen in the G-band intensity and LOS velocity at 8:35 UT (two left panels) and at 10:24 UT (two right panels). The violet arrow points the direction along the slice length. The purple and red iso-contours highlight velocities of ±130 m s−1, respectively.
Current usage metrics show cumulative count of Article Views (full-text article views including HTML views, PDF and ePub downloads, according to the available data) and Abstracts Views on Vision4Press platform.
Data correspond to usage on the plateform after 2015. The current usage metrics is available 48-96 hours after online publication and is updated daily on week days.
Initial download of the metrics may take a while.