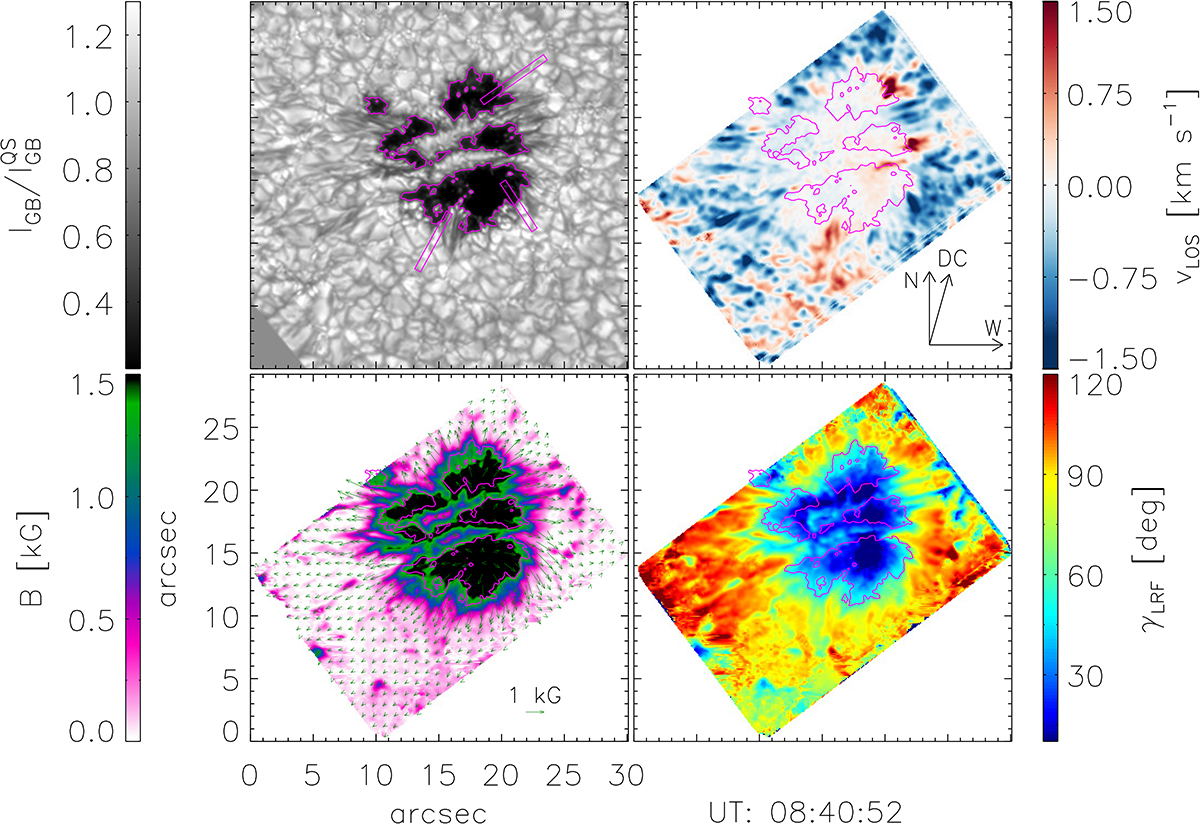
Fig. 1.
Download original image
Snapshot of NOOA 11024 sunspot at the early stages of penumbra development (08:40:52 UT) as seen in G-band intensity (upper left), LOS velocity (upper right), total magnetic field strength (lower left), and magnetic field inclination in the LRF (lower right). The pink iso-contour outlines the umbral boundary using a threshold of 50% of the quiet-Sun intensity. The three pink boxes in the G-band intensity maps mark the regions studied in detail. The maps have been rotated according to the solar north-south direction. A movie showing the temporal evolution is available online.
Current usage metrics show cumulative count of Article Views (full-text article views including HTML views, PDF and ePub downloads, according to the available data) and Abstracts Views on Vision4Press platform.
Data correspond to usage on the plateform after 2015. The current usage metrics is available 48-96 hours after online publication and is updated daily on week days.
Initial download of the metrics may take a while.