Open Access
Fig. 9.
Download original image
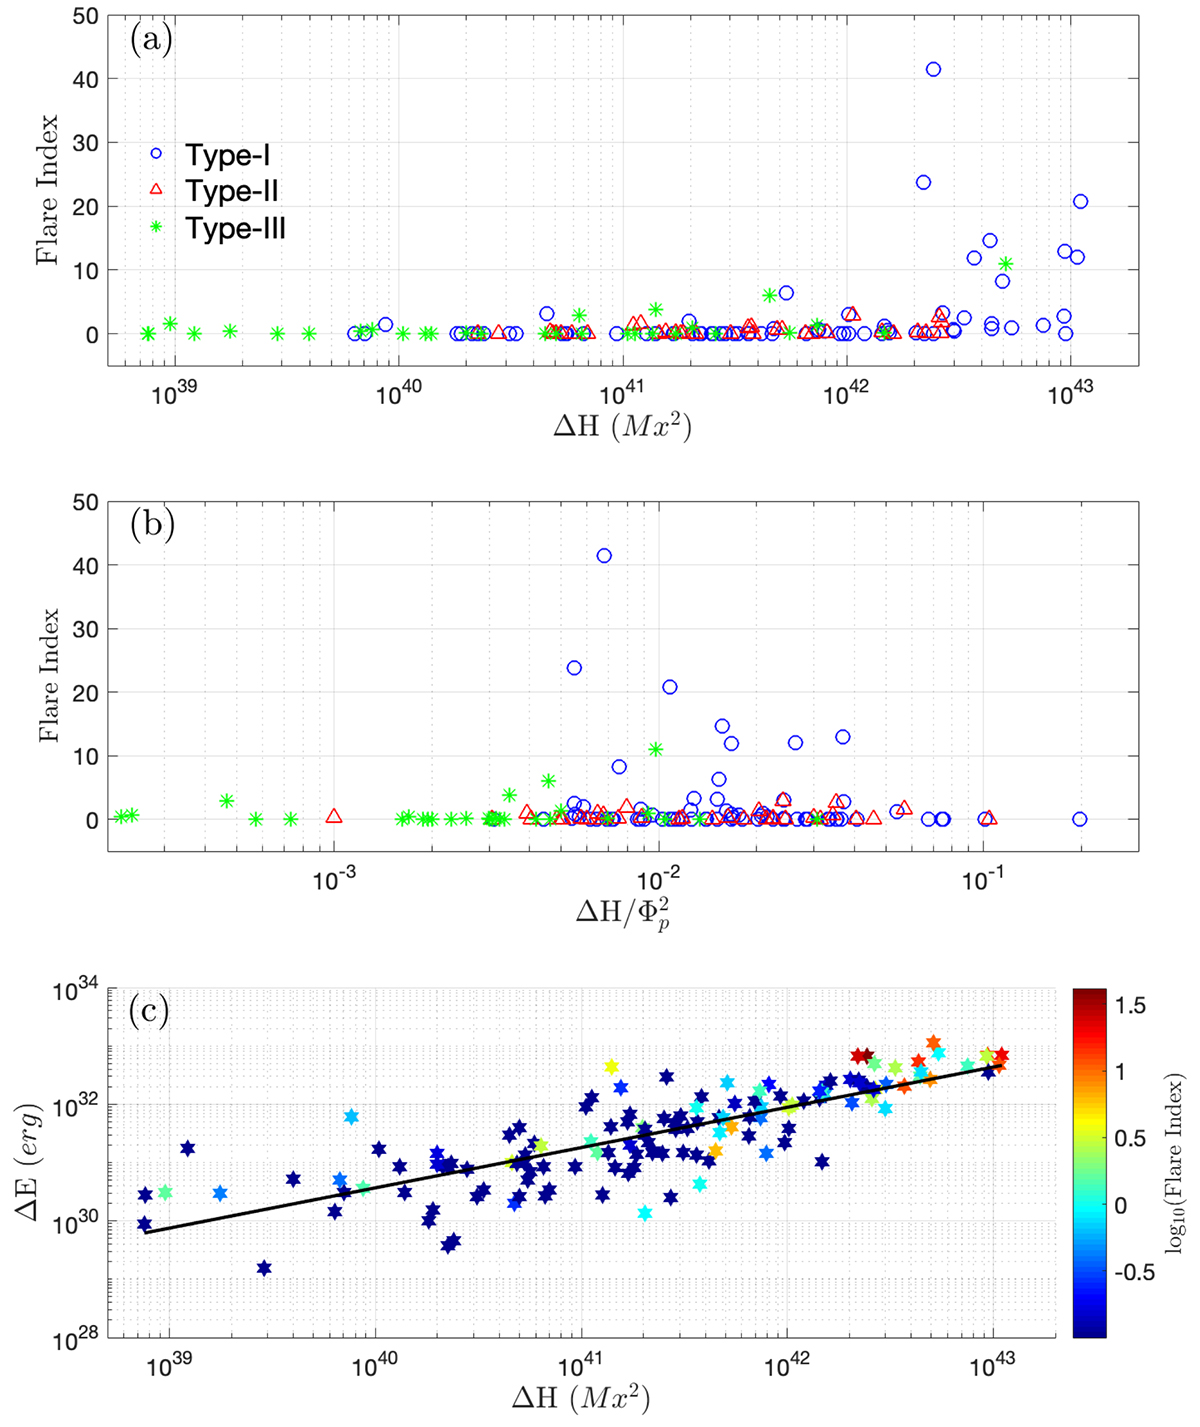
Scatter plots of the flare index versus the (a) accumulated helicity ΔH, (b) normalized helicity ΔH/![]() , and (c) ΔH − ΔE diagram. The color of the scatters in panel (c) indicate the value of the flare index. The black straight line represents the result of the least-squares best logarithmic fits between ΔE and ΔH.
, and (c) ΔH − ΔE diagram. The color of the scatters in panel (c) indicate the value of the flare index. The black straight line represents the result of the least-squares best logarithmic fits between ΔE and ΔH.
Current usage metrics show cumulative count of Article Views (full-text article views including HTML views, PDF and ePub downloads, according to the available data) and Abstracts Views on Vision4Press platform.
Data correspond to usage on the plateform after 2015. The current usage metrics is available 48-96 hours after online publication and is updated daily on week days.
Initial download of the metrics may take a while.